…but what does it look like?

It will soon be time to teach about finding the volumes of solid figures using integration techniques. Here is a list of links to posts that will help your students what these figures look like and how they are generated.

Visualizing Solid Figures 1 Here are ideas for making physical models of solid figures. These make good projects for students.

A Little Calculus is an iPad app that does an excellent job in helping students visualize many of the concepts of the calculus. Volumes with regular cross section, disk method, washer method, cylindrical shells are all illustrated.

The first illustrations show square cross sections on a semicircular base. The base is in the lower part and the solid in the upper. By using the plus and minus button (lower right) you can increase or decrease the number of sections in real time and see the figures change. The upper figure may be rotated by moving your finger on the screen.

The illustration below shows a washer situation.


The following older posts show how to use Winplot to generate and explore solid figures. Unfortunately, Winplot seems to have gone out of favor. I’m not sure why; it is one of the best. I still use it and like it. You may download Winplot here for free (PC only).

Visualizing Solid Figures 2 This post demonstrates how to use Winplot to generate solids with regular cross sections and solids of rotation.

Visualizing Solid Figures 3 The washer method is illustrated using Winplot. These post all relate to finding volumes by washers: Subtract the Hole from the Whole and Does Simplifying Make Things Simpler?

Visualizing Solid Figures 4 Using Winplot to see the method cylindrical shells. Note that this method is not tested on either the AB or BC Calculus exams, so you do not have to teach it. Many teachers present this topic after the exams are given. As a footnote you may also find Why You Never Need Cylindrical Shells interesting. (However, this is not the reason it is not tested on the AP Calculus exams.)

Visualizing Solid Figures 5 An exercise demonstrating how “half” can mean different things and shows that how the figures are generated makes a difference.

Posts on Accumulation

One of the main uses of the definite integral is summed up (pun intended) in the idea of accumulation. When you integrate a rate of change you get the (net) amount of change. This important idea is often treated very lightly, if at all, in textbooks.

Here are a series of past posts that use, explain, and illustrate that concept.

Accumulation – Need an Amount? The Fundamental Theorem of Calculus says that the integral of a rate of change (a derivative) is the net amount of change. This post shows how that works in practice.

AP Accumulation Questions and Good Question 7 – 2009 AB 3 the “Mighty Cable Company” show how accumulation is tested on the AP Calculus exams. The “Mighty Cable Company” question is a particularly good and difficult example.

The next two posts show how to use the concept of accumulation to analyze a function and its graph without reference to the derivative. The graphical idea of a Riemann sum rectangle moving across the interval of integration makes the features of function much more intuitive than the common approach. You will not find these ideas in textbooks. Nevertheless, a lesson on this idea may help your students.

Graphing with Accumulation 1 explains how to analyze the derivative to determine when a function is increasing or decreasing and finding the locations of extreme values. By thinking of the individual Rieman sum rectangles moving across the interval the features of the function are easy to see and easier to remember. Once understood, this method will help students with their graph analysis work.

Graphing with Accumulation 2 continues the idea of using accumulation to determine information about the concavity of a function.

Unit 8 – Applications of Integration

I haven’t missed Unit 7! This unit seems to fit more logically after the opening unit on integration (Unit 6). The Course and Exam Description (CED) places Unit 7 Differential Equations before Unit 8 probably because the previous unit ended with techniques of antidifferentiation. My guess is that many teachers will teach Unit 8: Applications of Integration immediately after Unit 6 and before Unit 7: Differential Equations. The order is up to you. Unit 7 will post next Tuesday.

Unit 8 includes some standard problems solvable by integration (CED – 2019 p. 143 – 161). These topics account for about 10 – 15% of questions on the AB exam and 6 – 9% of the BC questions.

Topics 8.1 – 8.3 Average Value and Accumulation

Topic 8.1 Finding the Average Value of a Function on an Interval Be sure to distinguish between average value of a function on an interval, average rate of change on an interval and the mean value

Topic 8.2 Connecting Position, Velocity, and Acceleration of Functions using Integrals Distinguish between displacement (= integral of velocity) and total distance traveled (= integral of speed)

Topic 8. 3 Using Accumulation Functions and Definite Integrals in Applied Contexts The integral of a rate of change equals the net amount of change. A really big idea and one that is tested on all the exams. So, if you are asked for an amount, look around for a rate to integrate.

Topics 8.4 – 8.6 Area

Topic 8.4 Finding the Area Between Curves Expressed as Functions of x

Topic 8.5 Finding the Area Between Curves Expressed as Functions of y

Topic 8.6 Finding the Area Between Curves That Intersect at More Than Two Points Use two or more integrals or integrate the absolute value of the difference of the two functions. The latter is especially useful when do the computation of a graphing calculator.

Topics 8.7 – 8.12 Volume

Topic 8.7 Volumes with Cross Sections: Squares and Rectangles

Topic 8.8 Volumes with Cross Sections: Triangles and Semicircles

Topic 8.9 Volume with Disk Method: Revolving around the x– or y-Axis Volumes of revolution are volumes with circular cross sections, so this continues the previous two topics.

Topic 8.10 Volume with Disk Method: Revolving Around Other Axes

Topic 8.11 Volume with Washer Method: Revolving Around the x– or y-Axis See Subtract the Hole from the Whole for an easier way to remember how to do these problems.

Topic 8.12 Volume with Washer Method: Revolving Around Other Axes. See Subtract the Hole from the Whole for an easier way to remember how to do these problems.

Topic 8.13  Arc Length BC Only

Topic 8.13 The Arc Length of a Smooth, Planar Curve and Distance Traveled  BC ONLY


Timing

The suggested time for Unit 8 is  19 – 20 classes for AB and 13 – 14 for BC of 40 – 50-minute class periods, this includes time for testing etc.


Previous posts on these topics for both AB and BC include:

Average Value and Accumulation

Average Value of a Function and 

Most Triangles Are Obtuse!

Half-full or Half-empty

Accumulation: Need an Amount?

AP Accumulation Questions

Good Question 7 – 2009 AB 3 Accumulation, explain the meaning of an integral in context, unit analysis

Good Question 8 – or Not Unit analysis

Graphing with Accumulation 1 Seeing increasing and decreasing through integration

Graphing with Accumulation 2 Seeing concavity through integration

Adapting AB 1 / BC 1

Area

Area Between Curves

Under is a Long Way Down  Avoiding “negative area.”

Improper Integrals and Proper Areas  BC Topic

Math vs. the “Real World”  Improper integrals  BC Topic

Adapting 2021 AB 3 / BC 3

Volume

Volumes of Solids with Regular Cross-sections

Volumes of Revolution

Why You Never Need Cylindrical Shells

Visualizing Solid Figures 1

Visualizing Solid Figures 2

Visualizing Solid Figures 3

Visualizing Solid Figures 4

Visualizing Solid Figures 5

Painting a Point

Subtract the Hole from the Whole and Does Simplifying Make Things Simpler?

Adapting 2021 AB 3 / BC 3

Other Applications of Integrals

Density Functions have been tested in the past, but are not specifically listed on the CED then or now.

Who’d a Thunk It? Some integration problems suitable for graphing calculator solution


Here are links to the full list of posts discussing the ten units in the 2019 Course and Exam Description.

2019 CED – Unit 1: Limits and Continuity

2019 CED – Unit 2: Differentiation: Definition and Fundamental Properties.

2019 CED – Unit 3: Differentiation: Composite , Implicit, and Inverse Functions

2019 CED – Unit 4 Contextual Applications of the Derivative  Consider teaching Unit 5 before Unit 4

2019 – CED Unit 5 Analytical Applications of Differentiation  Consider teaching Unit 5 before Unit 4

2019 – CED Unit 6 Integration and Accumulation of Change

2019 – CED Unit 7 Differential Equations  Consider teaching after Unit 8

2019 – CED Unit 8 Applications of Integration   Consider teaching after Unit 6, before Unit 7

2019 – CED Unit 9 Parametric Equations, Polar Coordinates, and Vector-Values Functions 

2019 CED Unit 10 Infinite Sequences and Series


The Old Pump

A tank is being filled with water using a pump that is old and slows down as it runs. The table below gives the rate at which the pump pumps at ten-minute intervals. If the tank initially has 570 gallons of water in it, approximately how much water is in the tank after 90 minutes?

Elapsed time (minutes)   0   10  20   30   40   50   60   70   80   90
Rate (gallons / minute)   42   40   38   35   35   32   28   20   19   10

And so, integration begins.

Ask your students to do this problem alone. When they are ready (after a few minutes) collect their opinions.  They will not all be the same (we hope, because there is more than one reasonable way to approximate the amount). Ask exactly how they got their answers and what assumptions they made. Be sure they always include units (gallons).  Here are some points to make in your discussion – points that we hope the kids will make and you can just “underline.”

    1. Answers between 3140 and 3460 gallons are reasonable. Other answers in that range are acceptable. They will not use terms like “left-sum”, “right sum” and “trapezoidal rule” because they do not know them yet, but their explanations should amount to the same thing. An answer of 3300 gallons may be popular; it is the average of the other two, but students may not have gotten it by averaging 3140 and 3460.
    2. Ask if they think their estimate is too large or too small and why they think that.
    3. Ask what they need to know to give a better approximation – more and shorter time intervals.
    4. Assumptions: If they added 570 + 42(10) + 40(10) + … +19(10) they are assuming that the pump ran at each rate for the full ten minutes and then suddenly dropped to the next. Others will assume the rate dropped immediately and ran at the slower rate for the 10 minutes. Some students will assume the rate dropped evenly over each 10-minute interval and use the average of the rates at the ends of each interval (570 + 41(10) + 39(10) + … 14.5(10) = 3300).
    5. What is the 570 gallons in the problem for? Well, of course to foreshadow the idea of an initial condition. Hopefully, someone will forget to include it and you can point it out.
    6. With luck someone will begin by graphing the data. If no one does, you should suggest it; (as always) to help them see what they are doing graphically. They are figuring the “areas” of rectangles whose height is the rate in gallons/minute and whose width is the time in minutes. Thus the “area” is not really an area but a volume (gal/min)(min) = gallons). In addition to unit analysis, graphing is important since you will soon be finding the area between the graph of a function and the x-axis in just this same manner.

Follow up: Flying to Integrationland

Be sure to check the “Thoughts on ‘The Old Pump'” in the comments section below.

Revised from a post of November 30, 2012. 

Adapting 2021 BC 2

Seven of nine. This week we continue our look at the 2021 free-response questions with an eye to ways to adapt and expand the questions. Hopefully, you will find ways to use this and other free-response questions to help your students learn more and be better prepared for the exams.

2021 BC 2

This is a Parametric and Vector Equation (Type 8) question and contains topic from Unit 9 of the current Course and Exam Description. The vector equation of the velocity of a particle moving in the xy-plane is given along with the position of the particle at t = 0. No units were given.

The stem for 2021 BC 2 is next. (Note the \displaystyle \left\langle \text{ } \right\rangle notation for vectors. Any of the usual notations may be used by students, but be sure to show them the others in case the one their book usage is different than the exam’s.)

Part (a): Students were asked to find the speed and acceleration of the particle at t = 1.2. This is a calculator active questions and the students were expected, but not actually required, to use their calculator. With their calculator in parametric mode, students should begin by entering the velocity as xt1(t) and yt1(t).

Discussion and ideas for adapting this question:

  • There is little I can suggest here other than changing the time.
  • At the given time and other times, you can ask in what direction is the particle moving and which way the acceleration is pulling the velocity.
  • Ask student to do this without using their calculator. The answer need not be simplified or expressed as a decimal.

Part (b): Asked the students to find the total distance traveled by the particle over a given the time interval. This must be done on a calculator. Be sure your students know how to enter the expression using the already entered values for xt1(t) and yt1(t). The calculator entry should look like this.

\displaystyle \int_{0}^{{1.2}}{{\sqrt{{{{{\left( {\text{xt}1(t)} \right)}}^{2}}+{{{\left( {\text{yt1}(t)} \right)}}^{2}}}}}}dt

Discussion and ideas for adapting this question:

  • Use different intervals.
  • Discuss the similarities with the number line distance formula. In linear motion, the distance is simply the integral of the absolute value of the velocity. Since \displaystyle \int_{a}^{b}{{\left| {v\left( t \right)} \right|}}dt=\int_{a}^{b}{{\sqrt{{{{{\left( {v(t)} \right)}}^{2}}}}}}dt
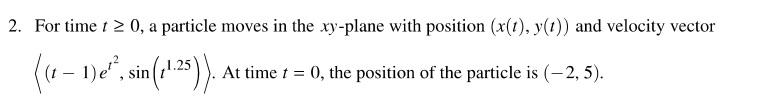
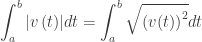
, this is the same formula reduced to one dimension.

Part (c): The situation is reduced to a one-dimensional problem: students were asked to find the coordinates of the point at which the particle is farthest left and explain why there is no point farthest to the right.

Discussion and ideas for adapting this question:

  • Discuss how to do this and how students should present their answer and explanation.
  • Show that this is the same as an extreme value problem and done the same way (i.e., find where the derivative is zero, and show that this is a minimum (farthest left), etc.).
  • Discuss how you know there is no maximum and interpret this in the context of the equation.

For further exploration. Try graphing the path of the particle. Discuss how to do that with your class. See what they suggest. Here a few approaches.

  • The first thought may be to integrate the velocity vector as an initial value problem. Unfortunately, this cannot be done. Neither the x-component nor the y-component can be integrated in terms of Elementary Functions. Even WolframAlpha.com is no help.
  • Having entered the velocity vector as xt1(t) and yt1(t), as suggested above, enter something like this depending on your calculator’s syntax and then graph in a suitable window. Compare the graph with the previous analysis in part (c)?

\displaystyle \text{x2t}(t)=-2+\int_{0}^{t}{{\text{x1t}(t)dt}}

\displaystyle \text{y2t}(t)=5+\int_{0}^{t}{{\text{y2t}(t)dt}}

  • You may also try expressing the components of velocity as a Taylor series centered at some positive number, a, not at zero. Integrate that to get an approximation to graph. Be sure to adjust things so the initial point is on the graph. WolframAlpha will help here. The one problem here is that the y-component is not defined for negative numbers. Therefore, zero cannt be then center and the largest the interval of convergence can be is [0, 2a] (Why?) and may not even by that large. This is an interesting approach mathematically but will not help with most of the graph.

Personal opinion: I do not think much of this question because all the first two parts require is entering the formula in your calculator and computing the answer, and the third part is really an AB level question. Just my opinion.


Seven of Nine

Next week 2021 BC 5

I would be happy to hear your ideas for other ways to use this question. Please use the reply box below to share your ideas.


Adapting 2021 AB 4 / BC 4

Four of nine. Continuing the series started in the last three posts, this post looks at the AP Calculus 2021 exam question AB 4 / BC 4. The series considers each question with the aim of showing ways to use the question with your class as is, or by adapting and expanding it.  Like most of the AP Exam questions there is a lot more you can ask from the stem and a lot of other calculus you can discuss.

2021 AB 4 / BC 4

This is a Graph Analysis Problem (type 3) and contains topics from Units 2, 4, and 6 of the current Course and Exam Description. The things that are asked in these questions should be easy for the students, however each year the scores are low. This may be because some textbooks simply do not give students problems like this. Therefore, supplementing with graph analysis questions from past exams is necessary.

There are many additional questions that can be asked based on this stem and the stems of similar problems. Usually, the graph of the derivative is given, and students are asked questions about the graph of the function. See Reading the Derivative’s Graph.

Some years this question is given a context, such as the graph is the velocity of a moving particle. Occasionally there is no graph and an expression for the derivative or function is given.

Here is the 2021 AB 4 / BC 4 stem:

The first thing students should do when they see G\left( x \right)=\int_{0}^{x}{{f\left( t \right)}}dt is to write prominently on their answer page {G}'\left( x \right)=f\left( x \right) and \displaystyle {G}''\left( x \right)={f}'\left( t \right). While they may understand and use this, they must say it.

Part (a): Students were asked for the open intervals where the graph is concave up and to give a reason for their answer. (Asking for an open interval is to remove any concern about the endpoints being included or excluded, a place where textbooks differ. See Going Up.)

Discussion and ideas for adapting this question:

  • Using this or similar graphs go through each of these with your class until the answers and reasons become automatic. There are quite a few other things that may be asked here based on the derivative.
    • Where is the function increasing?
    • Decreasing?
    • Concave down, concave up?
    • Where are the local extreme values?
    • What are the local extreme values?
    • Where are the absolute extreme values?
    • What are the absolute extreme values?
  • There are also integration questions that may be asked, such as finding the value of the functions at various points, such as G(1) = 2 found by using the areas of the regions. Also, questions about the local extreme values and the absolute extreme value including their values. These questions are answered by finding the areas of the regions enclosed by the derivative’s graph and the x-axis. Parts (b) and (c) do some of this.
  • Choose different graphs, including one that has the derivative’s extreme value on the x­-axis. Ask what happens there.

Part (b): A new function is defined as the product of G(x) and f(x) and its derivative is to be found at a certain value of x. To use the product rule students must calculate the value of G(x) by using the area between f(x) and the x-­axis and the value of {f}'\left( x \right) by reading the slope of f(x) from the graph.

Discussion and ideas for adapting this question:

  • This is really practice using the product rule. Adapt the problem by making up functions using the quotient rule, the chain rule etc. Any combination of \displaystyle G,{G}',{G}'',f,{f}',\text{ or }{f}'' may be used. Before assigning your own problem, check that all the values can be found from the given graph.
  • Different values of x may be used.

Part (c): Students are asked to find a limit. The approach is to use L’Hospital’s Rule.

Discussion and ideas for adapting this question:

  • To use L’Hospital’s Rule, students must first show clearly on their paper that the limit of the numerator and denominator are both zero or +/- infinity. Saying the limit is equal to 0/0 is considered bad mathematics and will not earn this point. Each limit should be shown separately on the paper, before applying L’Hospital’s Rule.
  • Variations include a limit where L’Hospital’s Rule does not apply. The limit is found by substituting the values from the graph.
  • Another variation is to use a different expression where L’Hospital’s Rule applies, but still needs values read from the graph.

Part (d): The question asked to find the average rate of change (slope between the endpoints) on an interval and then determine if the Mean Value Theorem guarantees a place where \displaystyle {G}' equals this value. Students also must justify their answer.

Discussion and ideas for adapting this question:

  • To justify their answer students must check that the hypotheses of the MVT are met and say so in their answer.
  • Adapt by using a different interval where the MVT applies.
  • Adapt by using an interval where the MVT does not apply and (1) the conclusion is still true, or (b) where the conclusion is false.

Next week 2021 AB 5.

I would be happy to hear your ideas for other ways to use this questions. Please use the reply box below to share your ideas.


Adapting 2021 AB 3 / BC 3

Three of nine. Continuing the series started in the last two posts, this post looks at the AB Calculus 2021 exam question AB 3 / BC 3. The series considers each question with the aim of showing ways to use the question in with your class as is, or by adapting and expanding it. Like most of the AP Exam questions there is a lot more you can ask from the stem and a lot of other calculus you can discuss.

2021 AB 3 / BC 3

This question is an Area and Volume question (Type 4) and includes topics from Unit 8 of the current Course and Exam Description. Typically, students are given a region bounded by a curve and an line and asked to find its area and its volume when revolved around a line. But there is an added concept here that we will look at first.

The stem is:

First, let’s consider the c. This is a family of functions question. Family of function questions appear now and then. They are discussed in the post on Other Problems (Type 7) and topics from Unit 8 of the current Course and Exam Description. My favorite example is 1998 AB 2, BC 2. Also see Good Question 2 and its continuation.

If we consider the function with c = 1 to be the parent function \displaystyle P\left( x \right)=x\sqrt{{4-{{x}^{2}}}} then the other members of the family are all of the form \displaystyle c\cdot P\left( x \right). The c has the same effect as the amplitude of a sine or cosine function:

  • The x-axis intercepts are unchanged.
  • If |c| > 1, the graph is stretched away from the x-axis.
  • If 0 < |c| < 1, the graph is compressed towards the x-axis.
  • And if c < 0, the graph is reflected over the x-axis.

All of this should be familiar to the students from their work in trigonometry. This is a good place to review those ideas. Some suggestions on how to expand on this will be given below.

Part (a): Students were asked to find the area of the region enclosed by the graph and the x-axis for a particular value of c. Substitute that value and you have a straightforward area problem.

Discussion and ideas for adapting this question:

  • The integration requires a simple u-substitution: good practice.
  • You can change the value of c > 0 and find the resulting area.
  • You can change the value of c < 0 and find the resulting area. This uses the upper-curve-minus-the-lower-curve idea with the upper curve being the x-axis (y = 0).
  • Ask students to find a general expression for the area in terms of c and the area of P(x).
  • Another thing you can do is ask the students to find the vertical line that cuts the region in half. (Sometimes asked on exam questions).
  • Also, you could ask for the equation of the horizontal line that cuts the region in half. This is the average value of the function on the interval. See these post 1, 2, 3, and this activity 4.

Part (b): This question gave the derivative of y(x) and the radius of the largest cross-sectional circular slice. Students were asked for the corresponding value of c. This is really an extreme value problem. Setting the derivative equal to zero and solving the equation gives the x-value for the location of the maximum. Substituting this value into y(x) and putting this equal to the given maximum value, and you can solve for the value of c.  

(Calculating the derivative is not being tested here. The derivative is given so that a student who does not calculate the derivative correctly, can earn the points for this part. An incorrect derivative could make the rest much more difficult.)

Discussion and ideas for adapting this question:

  • This is a good problem for helping students plan their work, before they do it.
  • Changing the maximum value is another adaption. This may require calculator work; the numbers in the question were chosen carefully so that the computation could be done by hand. Nevertheless, doing so makes for good calculator practice.

Part (c): Students were asked for the value of c that produces a volume of 2π. This may be done by setting up the volume by disks integral in terms of c, integrating, setting the result equal to 2π, and solving for c.

Discussion and ideas for adapting this question:

  • Another place to practice planning the work.
  • The integration requires integrating a polynomial function. Not difficult, but along with the u-substitution in part (a), you have an example to show people that students still must do algebra and find antiderivatives.
  • Ask students to find a general expression for the volume in terms of c and the volume of P(x).
  • Changing the given volume does not make the problem more difficult.

Next week 2021 AB 3/ BC 3.

I would be happy to hear your ideas for other ways to use this questions. Please use the reply box below to share your ideas.