
You have probably caught on by now that Winplot is my favorite computer graphing program. In addition to being great at drawing quick graphs, it is able to produce and rotate 3D images of, among other things, solids of rotation, and solids with regular cross-sections. In this post I will discuss how to do solids of regular cross-section and solids of rotation. In my next posts I’ll show you how to see the disks, washers, and shells.
Winplot is a free program. Click here for Winplot for PC and here for Winplot for Macs. (May 11, 2017 Note: Winplot is no longer available from its original home. The link for PCs above connect to another site where the program can be downloaded. For Macs use the PC link, but use the Winplot for Macs link for instructions and another program you will need.You can also Google Winplot and find other sites that have the program as well as many, many instructional videos.)
Solids with regular cross-sections
Consider the region bound by the graphs of 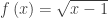

Begin by opening a Winplot 2D graphing window, graphing the curves, and adjusting the window to a good scale. Use the box where the equations are entered (Equa > 1.Explicit) check “lock interval,” and enter the “low x” and “high x” values (1 and 5 respectively) to stop the graphs where they intersect. Click “ok” to see the graphs.
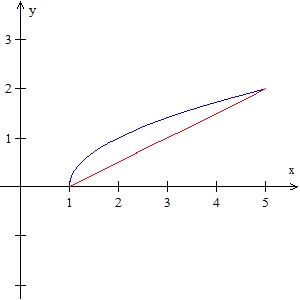
On the navigation bar, click on “Two” and then “Sections.” You should see a window like this:
The top two drop-down boxes at the top allow you to choose which curves to work with, and since we have only two they should already be selected. Then click on the cross-section shape you want – square, equilateral triangle, or semicircle. The box below that allows other shapes where the height may be set (the height(x) may be a number or a function of x). Set the “low x” and “high x” to the left and right sides of the region. Then click “see solid” and you will see the solid in a new window.
Click on the new 3D window and then type Ctrl+A to show the axes. Rotate the image by using the 4 arrow keys, and zoom in and out with the Page Up and Page Down keys.
 Now let’s get fancy. Close the 3D window and return to the cross-section box shown above. Change the “high x” to 5@B (you may use any almost letter except x, y, or z). Then click “see solid.” Next, in the 3D Window click Anim > Individual > B. This will give you a slider. Slide the slider from 1 to 5 and you will see the solid grow and see the square cross-sections. (The video uses the “autocyc” button – use S to slow the animation, F to speed it up and Q to quit.)
Use File > Save As… to save the image. It will save with the extension .wp3 and you will lose the original 2D graphs. The animation buttons will still work when you open it again.
Solids of Revolution.
Solids of rotation are done in a similar way. We will revolve the same curves around the horizontal line y = –1. Enter the curves as above and click on One > Revolve Surface. Curves are revolved one at a time, so choose the first curve from the drop-down box. Choose the axis the figure is to be rotated around by entering the values for a, b, and c in ax + by = c, or clicking on one of the axis buttons. For the “arc start” and “arc stop” values use the left and right ends of the region. The “angle start” and “angle stop” values are the default, 0 and 2pi (entered as “2pi”). Again we have made this last value 2pi@A so that we can animate the graph.

Click “see surface” to see the revolved surface. As before, use the 4 arrow keys and the Page Up and Page Down keys to adjust the image, and Ctrl+A to show the axes.
Surfaces are revolved one at a time so return to the “surface of revolution” window and use the drop-down box to choose the next curve. Leave all the other values the same. Clicking “see surface” will graph the second curve with the first and show the solid figure. Note that the surfaces are graphed in the same color as the original 2D graphs.
Use the slider or autorev or autocyc buttons to watch the curves revolve. (Remember to type “F” to speed up the motion. “S” to slow it down, and “Q” to quit.)
The next posts will show how to see the disks, washers, and shells, and animate them along with the surfaces.

Pingback: …but what does it look like? | Teaching Calculus
Hi Lin,
Thanks for this post – I refer to it every year before using WinPlot to help my students visualize the solids that are generated. Do you know if there is any way to generate solids with cross-sections perpendicular to the y-axis on WinPlot?
LikeLike
Richere,
I do not know of anyway of generating solids with cross-sections perpendicular to the y-axis using WinPlot. The “cross-section solid” button only does cross-sections perpendicular to the x-axis. You might try asking on the AP Calculus discussion group if anyone knows how to do this using Geogebra or some other program. You could try using a cross-section perpendicular to the x-axis and then turning the image so that it looks like one perpendicular to the y-axis. Sorry, but that’s the best I can suggest.
LikeLike
Thanks – if I made my own (I just did y = 2x and y = x^2) and have them automatically revolving in a window and wanted to make a gif of these to put in a website or smartboard file, any ideas of creating that gif with my own graphs?
Thanks for the great ideas!
P.S. When I started teaching AP Calculus, I became a point-slope convert – love reading your views on that topic.
LikeLike
Matt
To make the .gif files I found a free .GIF movie maker on line called GIF Screen Recorder. I can’t find the one I use online this morning, but there are plenty of other for free. There are other movie makers out there in different formats. I have to use .gif since that’s the one that will upload to the blog.
LikeLike
Thanks Lin – that worked great! I put it in a Smartboard file and then put it in an Explain Everything APP video – looks awesome!
LikeLike
Lin –
I would love to embed this in a site for my students to look at (as a resource or when they have been absent) – how did you copy the animations in to your site?
LikeLike
Try this, it worked for me. Right click on the image or video and click “Save image as…” Save it as a .gif file (that sould be what it suggests). Then open it in a player that can play .gif file such as Quick Time.
Or just give your kids the URL.
Or since Winplot is free have them download it and then follow the directions and make their own file.
LikeLike