
The shape of various solids of rotation and solids with regular cross-sections of which beginning calculus students are required to find the volume are often difficult to visualize. This post and the next two will discuss some of the ways you can help your students become familiar with these shapes. Teachers often use these as projects for students to get some hands-on familiarity with the figures. In fact, it is one of the few places where a useful project can be assigned.
Actually, rotate a region:
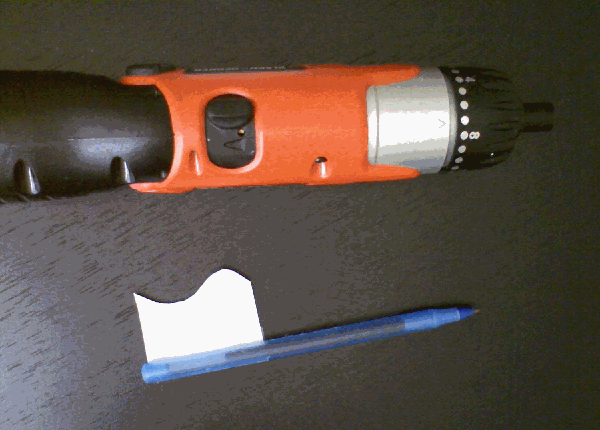
Begin by drawing the region to be revolved (from the curve to the line of rotation) on paper and cut it out. Tape the region along the line to a pencil, pen, or dowel. Roll the dowel back and forth between your hands or, as shown in the video below, with a small electric drill or screwdriver. You can get a rough idea of the shape.
Go to a wedding:
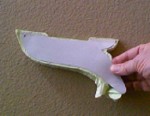
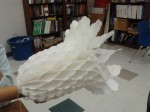
Decorations for weddings and other festive events are made from paper and fold flat. When opened you get a solid of rotation.
Measure a volume:
Take a solid fruit (like a banana), or a vegetable (like a cucumber, or carrot) and find its volume by cutting it into “coin” shaped pieces. Multiply the thickness by the area of the circular ends of each piece and then add them to find the volume.
For more of a challenge use a loaf of sliced bread (here you will need a way to calculate the area of the non-circular ends – inscribed rectangles perhaps). You could also approximate the volume of a tree trunk by measuring the circumference at regular distances along the trunk.
Build a model:
This method can be used for solids or rotation and is especially good for solids with regular cross-sections. It is also a good project for a student or group of students.
- Carefully graph the region using a somewhat larger than normal scale.
- Draw lines at 1/8 to ¼ inch intervals across the region perpendicular to the appropriate axis.
- Carefully measure or calculate the length of each of these lines. Use this for the appropriate dimension for the question. For example, this may be the side of the square cross-section, or the diameter of a semi-circular section.
- Use the dimension to draw a series of squares, semi-circles, or whatever from cardboard, plywood, or foam board.
- Cut these out and assemble them on the original region you graphed to approximate the solid figure. Tape or glue them in place.
- Extra: Calculate the area of each piece and multiply it by the thickness (or the distance between pieces) and see how closely this comes to the calculated volume.
-
- Square cross-sections from scrap wood.
-
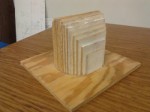
- Square cross-sections on a circular base made from scrap plywood.
-
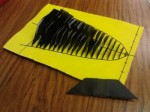
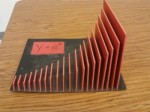
- Trapezoidal sections on parabolic base made from 5.25 inch floppy disks.
-
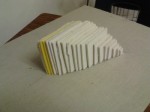
- Square cross-sections on base between a parabola and a line made with foam board.
-
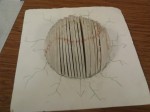
- Semi-circular cross-sections on a circular base made from foam board.
These pictures are of models made by students of Mrs. Dixie Ross at Pflugerville (Texas) High School. Students received more points if they recycled materials.Thank you Dixie!
