A fairly common max/min problem asks the student to find the point on the parabola  that is closest to the point
  . The solution is not too difficult. The distance, L(x), between A and the point
  on the parabola is given by

And the minimum distance can be found when
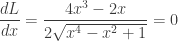
This occurs when  . The local maximum is occurs when x = 0. The (global) minimums are the other two values located symmetrically to the y-axis.
_________________________
Somewhere I saw this problem posed in terms of a marble dropped into a vase shaped like a parabola. So I think of it that way. This accounts for the title of the post. The problem is, however, basically a two-dimensional situation.
In this post I would like to expand and explore this problem. The exploration will, I hope, give students some insight and experience with extreme values, and the relationship between a graph and its derivative. I will pose a series of questions that you could give to your students to explore. I will answer the questions as I go, but you, of course, should not do that until your students have had some time to work on the questions.
Graphing technology and later Computer Algebra Systems (CAS) will come in handy.
_________________________
1. Consider a general point  on the y-axis. Find the x-coordinates of the closest point on the parabola in terms of a.
The distance is now given by


And  when
when 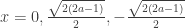
The (local) maximum is at x = 0. The other values are the minimums. The CAS computation is shown at the end of the post. This is easy enough to do by hand.
2. Discuss the equation  in relation to this situation.
This is the equation of a circle with center at A with radius of L. At the minimum distance this circle will be tangent to the parabola.
3. What happens when  and when
  ?
?
When , the three zeroes are the same. The circle is tangent to the parabola at the origin and a is the minimum distance.
When , the circle does not intersect the parabola. Notice that in this case two of the roots of  are not Real numbers.
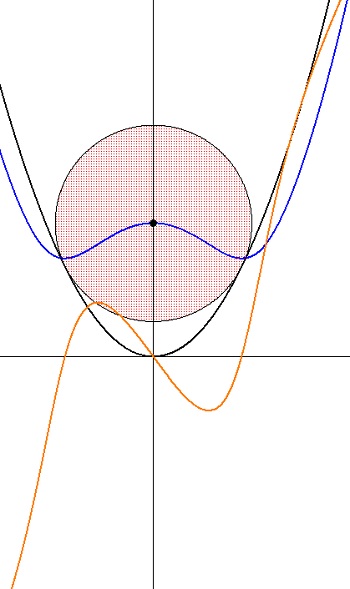
4. Consider the distance, L(x), from point A to the parabola. As x moves from left to right describe how this length changes. Be specific. Sketch the graph of this distance y = L(x). Where are its (local) maximum and minimum values, relative to the parabola and the circle tangent to the parabola?
The clip below illustrates the situation. The two segments marked L(x) are congruent. The graph of y = L(x) is a“w” shape similar to but not quartic polynomial. The minimums occur directly under the points of tangency of the circle and the parabola. The local maximum is directly over the origin. Is it coincidence that the graph goes through the center of the circle? Explain.
 5. Graph
  and compare its graph with the graph of

L(x) is the blue graph and and L'(x) is the orange graph.
Notice the concavity of L'(x)
6. The graph of appears be concave up, then down, then (after passing the origin) up, and then down again. There are three points of inflection. Find their x-coordinates in terms of a. How do these points relate to y = L(x) ? (Use a CAS to do the computation)
The points of inflection of the derivative can be found from the second derivative of the derivative (the third derivative of the L(x)). The abscissas are  . The CAS computation is shown below

CAS Computation for questions 1 and 6.


 . This is a way of controlling the “a” slider and should always be multiplied by antiderivative. This is just a syntax trick to make the graph work and is not part of the antiderivative. When x is to the left of a, (x < a) the fraction is 1 and the graph will be seen; when x is to the right of a, (x > a) the expression is undefined, and nothing will graph. As you change “a” with the slider the graph of an antiderivative will be drawn.
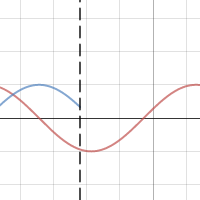
 . The surface area including the top and bottom is given by
 , the surface area, S, can be expressed as
![\displaystyle r=\sqrt[3]{\frac{V}{2\pi }}](https://s0.wp.com/latex.php?latex=%5Cdisplaystyle+r%3D%5Csqrt%5B3%5D%7B%5Cfrac%7BV%7D%7B2%5Cpi+%7D%7D&bg=ffffff&fg=333333&s=0&c=20201002) and substituting into the expression above
and substituting into the expression above ![\displaystyle h=\sqrt[3]{\frac{4V}{\pi }}](https://s0.wp.com/latex.php?latex=%5Cdisplaystyle+h%3D%5Csqrt%5B3%5D%7B%5Cfrac%7B4V%7D%7B%5Cpi+%7D%7D&bg=ffffff&fg=333333&s=0&c=20201002) .
.![\displaystyle \frac{h}{r}=\sqrt[3]{\frac{\frac{4V}{\pi }}{\frac{V}{2\pi }}}=2](https://s0.wp.com/latex.php?latex=%5Cdisplaystyle+%5Cfrac%7Bh%7D%7Br%7D%3D%5Csqrt%5B3%5D%7B%5Cfrac%7B%5Cfrac%7B4V%7D%7B%5Cpi+%7D%7D%7B%5Cfrac%7BV%7D%7B2%5Cpi+%7D%7D%7D%3D2&bg=ffffff&fg=333333&s=0&c=20201002) , so
, so  . In the optimum can the height is equal to the diameter.

 on the closed interval [1, 12].
 , between the endpoints of the function. Give the decimal value of its slope and give a graph of the function and the line.
 that gives the vertical distance between
  and
and  .
. . The leading coefficient k will eventually divide out and not be a concern.
 and
and  . This means that the extreme values are the same as a point on the graph 3h units away on the other side of the y-axis. This is mildly interesting in itself. The reason it is mentioned id that we will use these points soon.
 which is really true for any points at equal distances on opposite sides of the origin. This is obvious from the symmetry of the cubic.


 . The equation can be solved by hand. We know that x = h is one solution. Synthetic division will give a quadratic and the quadratic formula will do the rest.


 is the Golden Ratio and
  is the reciprocal of the Golden Ratio.
 , which of the following values is the greatest?
 changes from positive to negative.”
  and the maximum value of
  ….” And then ask any of the questions above – some answers will be different, some will be the same. Discussing which will not change and why makes a worthwhile discussion.
 and ask the questions above. Again most of the answers will change.
  and ask the questions above. This time most of the answers will change.