
We spend a lot of time in calculus studying curves. We look for maximums, minimums, asymptotes, end behavior, and on and on, but what about in “real life”?
For some time, I’ve been trying to find a real situation determined or modeled by a non-trigonometric curve with more than one extreme value. I’ve not been very successful. I knew of only one and discovered a second in writing this post. Here is an example that illustrates what I mean.
Example 1: This is a very common calculus example. Squares are cut from the corners of a cardboard sheet that measures 20 inches by 40 inches. The remaining sides are folded up to make a box. How large should the squares be to make a box of the largest possible volume?
If we let x = the length of the side of the square, then the volume of the box is given by V = x (20 –2 x)(40 – 2x)
The graph of the volume is shown in Figure 1 and sure enough we have a polynomial curve that has two extreme values. But wait. Do we really have two extreme values? The domain of the equation appears to be all real numbers, but in fact it is 0 < x < 10, since x cannot be negative, and if x > 10, then the (20 –2 x) side is negative and that won’t work either. Figure 2 shows the true situation. There is only one extreme value.
-
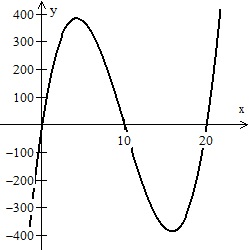
- Figure 1
-
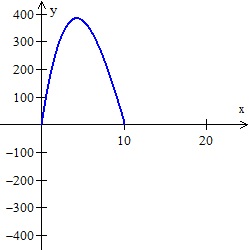
- Figure 2
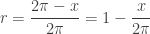
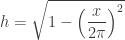
Example 2: This is also an optimization problem, but a bit more difficult. A sector is cut from a circular paper disk of radius 1. The remaining part of the disk is formed into a cone. How long should the curved part of the sector be so that the cone has the maximum volume? You might want to try this before you read further.
Let x be the length of curved part of the sector See Figure 3.
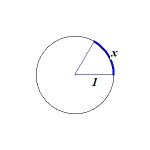
The radius of the disk becomes the slant height of the cone. The circumference of the disk is 

-
- Figure 3
-
- Figure 4
The volume of the cone is .

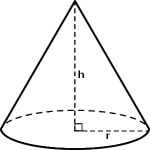
The graph of this equation is shown in Figure 5, and has two maximum values and a minimum. The domain appears to be 


-

- Figure 5
-
- Figure 6
(For the original expression the minimums are at 

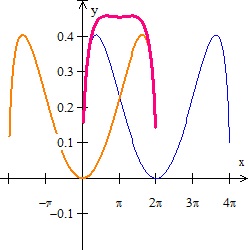
- Extension 1: Find the value of x that will make the largest volume when the piece cut out is formed into a cone. Compare the two graphs and explain their congruence. See Figure 7.
- Extension 2: Here I finally found what I was after. – a situation with more than one extreme value. Find the value of x that will make the largest total volume formed when the volume of the original cone and the cone formed by the piece cut out. Compare the first two graphs and the graph of this volume. See figure 8 – the magenta graph.
-

- Figure 7
-
- Figure 8
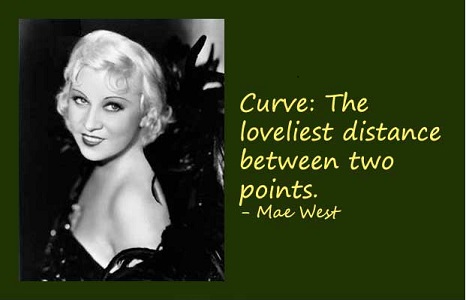
The Mae West Curve
There is at least one real situation that is modeled by a function with several extreme values. Spud’s blog gives the following explanation and illustration.
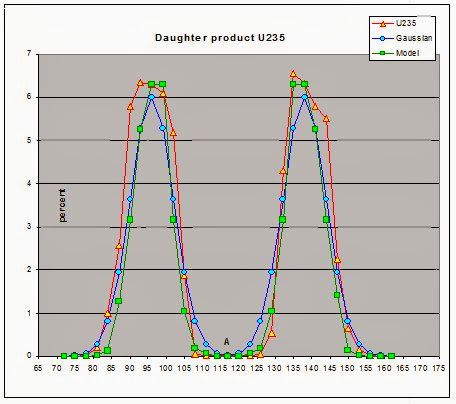
“When a Uranium (or Plutonium) atom fission, or splits, you end up with two much lighter atoms, called fission products, or daughter nuclides. The U-235 nucleus can split into a myriad of combinations, but some combinations are more likely than others.
“[Figure 9 below] shows the percentage of fission products by [atomic] mass[, A]. [This is] called the Mae West curve. … Note that the more likely fission products have two peaks at a mass of about 95 and 135.”
Thus we have a real life illustration of a model that has three extreme values in its domain.
The model graphed in Figure 9 is known as the “Mae West Curve,” named after Mae West (1893 – 1980) and actress, playwright and screenwriter.
-
- Figure 9: The “Mae West” Curve
If you know of any other real situations with more than one extreme, please let us know. Use the “comment” button below.
.
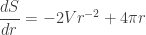
 . The surface area including the top and bottom is given by
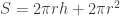
 , the surface area, S, can be expressed as
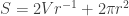
![\displaystyle r=\sqrt[3]{\frac{V}{2\pi }}](https://s0.wp.com/latex.php?latex=%5Cdisplaystyle+r%3D%5Csqrt%5B3%5D%7B%5Cfrac%7BV%7D%7B2%5Cpi+%7D%7D&bg=ffffff&fg=333333&s=0&c=20201002) and substituting into the expression above
and substituting into the expression above ![\displaystyle h=\sqrt[3]{\frac{4V}{\pi }}](https://s0.wp.com/latex.php?latex=%5Cdisplaystyle+h%3D%5Csqrt%5B3%5D%7B%5Cfrac%7B4V%7D%7B%5Cpi+%7D%7D&bg=ffffff&fg=333333&s=0&c=20201002) .
.![\displaystyle \frac{h}{r}=\sqrt[3]{\frac{\frac{4V}{\pi }}{\frac{V}{2\pi }}}=2](https://s0.wp.com/latex.php?latex=%5Cdisplaystyle+%5Cfrac%7Bh%7D%7Br%7D%3D%5Csqrt%5B3%5D%7B%5Cfrac%7B%5Cfrac%7B4V%7D%7B%5Cpi+%7D%7D%7B%5Cfrac%7BV%7D%7B2%5Cpi+%7D%7D%7D%3D2&bg=ffffff&fg=333333&s=0&c=20201002) , so
, so  . In the optimum can the height is equal to the diameter.
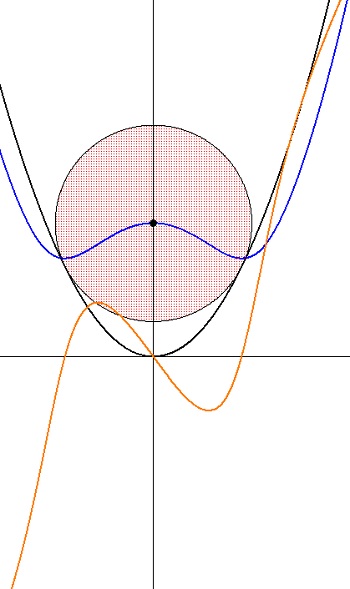
 that is closest to the point
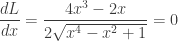
  . The solution is not too difficult. The distance, L(x), between A and the point
  on the parabola is given by
 . The local maximum is occurs when x = 0. The (global) minimums are the other two values located symmetrically to the y-axis.
 on the y-axis. Find the x-coordinates of the closest point on the parabola in terms of a.

 when
when 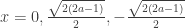
 in relation to this situation.
 and when
  ?
? are not Real numbers.
 and compare its graph with the graph of
 . The CAS computation is shown below

 radians. If you work in degrees, this sector’s area is
  and you will find that
 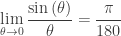 .
.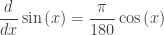 . This means that with the derivative or antiderivative of any trigonometric function that
  is there getting in the way.
 .
.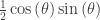
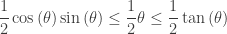
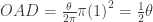 . The sector’s area is larger than the area of triangle OAB.
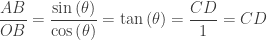 .
. This is larger than the area of the sector, which establishes the inequality above.
 and take the reciprocal to obtain
 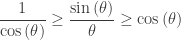 .
. and the limit
  where m is the mass of the object and v is its velocity. The mass of a rocket decreases at a constant rate of 25 kg/sec due to the burning of its fuel. When the mass of the rocket is 6000 kg, the velocity is 12 m/sec and increases at the rate of 2 m/sec/sec. At this instant how fast is the kinetic energy in changing? (The units are joules / sec.)
 where m is the mass of the object and a is its acceleration. A rocket sled is propelled along a track with an acceleration given by
  . When t = 6 sec. its mass is 10 kg and is decreasing at the rate of 0.2 kg/sec due to the burning of its fuel. At this instant how fast is the force changing?