Determining the Indeterminate

When determining the limit of an expression the first step is to substitute the value the independent variable approaches into the expression. If a real number results, you are all set; that number is the limit.

When you do not get a real number often expression is one of the several indeterminate forms listed below:

Indeterminate Forms:

\displaystyle \frac{0}{0},\quad \quad \frac{\pm \infty }{\pm \infty },\quad \quad 0\cdot \infty ,\quad \quad \infty -\infty ,\quad \quad {{0}^{0}},\quad \quad {{1}^{\infty }},\quad \quad {{\infty }^{0}}

They are called indeterminate forms because by doing some algebraic manipulation to simplify (or sometimes complicate) the expression its value can be determined. The calculus technique called L’Hôpital’s Rule may be used in some situations.

Part of the reason they are called indeterminate forms is that different expressions with the same indeterminate form may result in different values.

Before continuing with the discussion of indeterminate forms, I should point out that there are also determinate forms: expressions similar to those above that always result in the same value.

Determinate Forms and the values they approach:

\displaystyle \frac{1}{\pm \infty }\to 0,\quad \infty +\infty \to \infty ,\quad \infty \cdot \infty \to \infty ,\quad {{0}^{\infty }}\to 0,\quad \frac{1}{{{0}^{\infty }}}={{0}^{-\infty }}\to \infty

Returning to indeterminate forms, textbooks contain examples and exercises that illustrate how to evaluate the indeterminate forms. Here are two examples illustrating a few of the techniques that can be used to evaluate them.


Example 1:  \displaystyle \underset{x\to \infty }{\mathop{\lim }}\,{{\left( 1+\frac{1}{x} \right)}^{x}}=?.This is an example of the indeterminate form {{1}^{\infty }}. With exponents, logarithms may often be used to find the value.

\displaystyle \ln \left( ? \right)=\underset{x\to \infty }{\mathop{\lim }}\,\left( x\ln \left( 1+\frac{1}{x} \right) \right)=\underset{x\to \infty }{\mathop{\lim }}\,\frac{\ln \left( 1+\frac{1}{x} \right)}{\frac{1}{x}}

The limit is now of the indeterminate form \frac{0}{0}, so L’Hôpital’s Rule may be used. Continuing

\displaystyle \ln \left( ? \right)=\underset{x\to \infty }{\mathop{\lim }}\,\left( x\ln \left( 1+\frac{1}{x} \right) \right)=\underset{x\to \infty }{\mathop{\lim }}\,\frac{\ln \left( 1+\frac{1}{x} \right)}{\frac{1}{x}}=\underset{x\to \infty }{\mathop{\lim }}\,\frac{\left( \frac{1}{1+\frac{1}{x}} \right)\left( -{{x}^{-2}} \right)}{-{{x}^{-2}}}=\underset{x\to \infty }{\mathop{\lim }}\,\left( \frac{1}{1+\frac{1}{x}} \right)=1

So then ln(?) = 1 and ? = e1 = e and therefore \displaystyle \underset{x\to \infty }{\mathop{\lim }}\,{{\left( 1+\frac{1}{x} \right)}^{x}}=e


Example 2: \displaystyle \underset{x\to 0}{\mathop{\lim }}\,\left( \frac{\sin \left( x+\frac{\pi }{6} \right)}{x}-\frac{\sin \left( \frac{\pi }{6} \right)}{x} \right) is an example of the indeterminate form \infty -\infty .

Write the expression with a common denominator:

\displaystyle \underset{x\to 0}{\mathop{\lim }}\,\left( \frac{\sin \left( x+\frac{\pi }{6} \right)}{x}-\frac{\sin \left( \frac{\pi }{6} \right)}{x} \right)=\underset{x\to 0}{\mathop{\lim }}\,\left( \frac{\sin \left( \frac{\pi }{6}+x \right)-\sin \left( \frac{\pi }{6} \right)}{x} \right)=\cos \left( \frac{\pi }{6} \right)=\frac{\sqrt{3}}{2}

The second limit above is the definition of the derivative of \sin \left( \frac{\pi }{6} \right). (L’Hôpital’s Rule may also be used with the second limit above.)

In fact, the definition of the derivative of all (any, every) functions, \displaystyle {f}'\left( a \right)=\underset{h\to 0}{\mathop{\lim }}\,\frac{f\left( a+h \right)-f\left( a \right)}{h}, gives indeterminate expressions of the form \frac{0}{0}.


.

Matching Motion

Particle motion 2

Here’s a little matching quiz. In the function column there is a list of properties of functions and in the motion column are a list of terms describing the motion of a particle. The two lists are very similar. Match the terms in the function list with the corresponding terms in the Linear Motion list (some may be used more than once). The answers are below. For more on this idea see my previous post Motion Problems: Same Thing, Different Context.

Function                                               Linear Motion
1. Value of a function at x                     A. acceleration
2. First derivative                                  B. “at rest”  
3. Second derivative                             C. farthest left 
4. Function is increasing                       D. farthest right
5. Function is decreasing                      E. moving to the left or down 
6. Absolute Maximum                          F. moving to the right or up
7. Absolute Minimum                            G. object changes direction
8. y ʹ = 0                                                H. position at time t
9. y ʹ changes sign                                I. speed 
10. Increasing & concave up                J. speed is decreasing
11. Increasing & concave down           K. speed is increasing
12. Decreasing & concave up              L. velocity
13. Decreasing & concave down             
14. Absolute value of velocity      


Answers:  1. H,   2. L,   3. A,   4. F,   5. E,   6. D,   7. C,   8. B,   9. G,   10. K,   11. J,   12. J,   13. K,   14. I


Using the Derivative to Graph the Function

In my last post I showed how to use a Desmos graph to discover, by looking at the tangent line as it moved along the graph of the function, the properties of the derivative of a function. This post goes in the opposite direction. Now, instead of discovering the properties of the derivative from the graph of the function, we will use that knowledge to identify important information about the function from the graph of its derivative. We are not discovering anything here; rather we are putting our previous discoveries to use.

One of the uses of the derivative is to deduce properties of its antiderivative, i.e. the function of which it is the derivative. This is an important skill for students to be able to use. It is also a type of question that appears on every Advanced Placement Calculus exam in both the free-response sections and the multiple-choice sections. My previous post on this topic, Reading the Derivative’s Graph, is the most read post on this blog. This post expands on the concepts in that post and shows how to use the Desmos file to help students develop the skills necessary to answer this type of question.

Desmos is free. You and your students can set up their own account and save their own work there. There are also free Desmos apps for tablets and smart phones.

Click on the graph above. Here’s what you should see:

  • The first equation on the left side is f(x). This is the function whose antiderivative we will be trying to create. You may change this to any function you wish.
  • The second equation is F(x) the antiderivative of f(x). That is ‘(x) = f(x). Desmos cannot compute an antiderivative so you will need to enter it yourself. Your students need not trust you on this: have them check your equation by differentiating. Of course, at this point they will not be ready to find the analytic form of the antiderivative except for the simplest functions. This comes later in the year.
  • Note the “+C” is included and later we will manipulate this with a slider.
  • The antiderivative is multiplied by \frac{\sqrt{a-x}}{\sqrt{a-x}}. This is a way of controlling the “a” slider and should always be multiplied by antiderivative. This is just a syntax trick to make the graph work and is not part of the antiderivative. When x is to the left of a, (x < a) the fraction is 1 and the graph will be seen; when x is to the right of a, (x > a) the expression is undefined, and nothing will graph. As you change “a” with the slider the graph of an antiderivative will be drawn.
  • The third equation x = a graphs a dashed vertical to help you line up the corresponding points on the two graphs.
  • The next two lines are the “a” and “C” sliders. Make C = 0 for now and move the “a” slider.

At this point students should know things about the relationship between a function and its first and second derivatives. This includes the things they discovered in the previous post such as when the function is increasing the derivative is non-negative, and when the tangent line is above the graph the slope (derivative) is decreasing and the graph of the function is concave down. All of these concepts are really “if, and only if” situations. So we now consider them in reverse and deduce properties of the antiderivative from the properties of the graph of the derivative.

Using the “a” slider starting at the left side of the graph ask the students what the derivative tells them about the function in this part of the domain. Is the function increasing or decreasing? Is it concave up or down? etc.  Go slowly from left to right asking what happens next, and why (that is, how do you know? What feature of the derivative tells you this?) This is preparing them to write the justifications required on the AP exams.

Certain points on the graph of the derivative are important. The zeros of the derivative and whether the derivative changes from positive to negative, negative to positive, or neither are important. Likewise, the extreme values of the derivative point to important features of the function – points of inflection.

Once you have a complete graph of the antiderivative move the “C” slider.

  • Remind students that the derivative of a constant is zero and therefore, the C does not show up in the derivative.
  • Discuss is why changing the antiderivative does not change the derivative.
  • Ask, how many functions have the same derivative?
  • Point out is that by changing “C” the graph of an antiderivative can be made to go through any (every, all) point in the plane.

Switch to a different function and its derivative to reinforce the concepts. Yo will have to enter both the derivative and the antiderivative.Do this as often as necessary. You could also give students or groups of students the graph of a derivative (on paper) and challenge them to sketch the antiderivative.

A disclaimer: A function and its derivative should not be graphed on the same axes, because the two have different units. Nevertheless, I have done it here, and it is commonly done everywhere, to compare the graphs of a function and its derivative so that the important features of the two can be lined up and easily compared.

.


Tangents and Slopes

Using the function to learn about its derivative. 
In this post we will look at a way of helping students discover the numerical and graphical properties of the derivative and how they can be determined from the graph of the function. These ideas can be used very early, when you are first relating the function and its derivative. (In my next post we will look at the problem the other way around – using the derivative to find out about the function.)
Click on the graph below. This will take you to a graph I posted on the Desmos website (Desmos.com). This is a free and really easy to use grapher, which you and your students can use. If you sign up for your own account, you can make and save graphs for your class or use some of those that are built-in (click on the three horizontal bars at the upper left of the screen). Your students may do this as well. There are also Desmos apps for smart phones and tablets.

When you click on the graph a file called “function => derivative” should open. This is what you should see:
On the left is a list of equations. Those with a colored circle to its left are turned on; click the circle to toggle the graphs on and off. Here’s what they do:

  • f(x) is the equation of the function we will start with. Later you may change this to whatever function you are investigating. You will not have to change any of the others when you change the function. This one should be turned on.
  • g(x) is the derivative of f(x). Leave this turned off.
  • h(x) is a special function. The expression at the end, \frac{\sqrt{a-x}}{\sqrt{a-x}}, is what makes the slider work. This is a syntax trick and not part of the derivative. If x is to the right of a (i.e. x < a) the expression is equal to one and the derivative will graph. If x is to the right of a, (i.e. a < x) then the expression is undefined, and nothing will graph. Initially, turned off.
  • k(x) is the graph of a segment tangent to f at x = a. Click on the equation if you want to see how the segment is drawn by restricting the domain of x. Initially, turned on.
  • The next equation, x = a, is the equation of the dashed vertical line. This is included so that, later, we can see precisely how points on the graph are located above one another. Initially, turned off.
  • (a, f(a)) is the point of tangency. Initially, turned on.
  • The last box is the slider for the variable a. Its domain is shown at the ends. This may be changed by clicking on one end or clicking on the “gear” icon at the top of the list.

The icons at the top right of the graph let you zoom in and out or set the viewing window. You may click on the wrench icon and make other adjustments. “Projector Mode” makes the graph thicker and may help students see better when you project the graph.
Okay, you are now Desmos experts! Really, it’s that easy. The “?” at the top right has a few more instructions and you can download the user’s guide, a brief 13 pages.


Investigating the derivative
Do this before proving all the associated theorems. Let the class discover the relations between the graph of the function and its derivative. Prove them, or explain why they are so, later. You may want to spread all this over several days, perhaps dealing with where the function is increasing or decreasing and extreme values the first day and working with concavity the second.
1. Begin with just f(x), k(x), and the point (a, f(a)) turned on (click the circle to the left of the equation to toggle graphs on and off). Use the slider to move the tangent segment along the graph.
Draw the class’s attention to important things but let them formulate the observations in words. Ask your class a series of questions about what they see. Things like:

  • When the function is increasing, is the slope of the tangent segment positive or negative? When the function is decreasing, is the slope of the tangent segment positive or negative? Why?
  • What happens with the derivative when the function changes from increasing to decreasing or vice versa?
  • Notice that sometimes the tangent segment lies above the function and sometimes below. What does the function look like when the tangent is above (below)?
  • In the box for the slider delete the number and type a = 0; this moves the slider to the origin. Can you see what its slope is here? You can type in other numbers such as pi/6, or pi/2 and read the slope there. (If the slider disappears when you do this, type in a = 0 and it will come back.)
  • If you can project on a white board or are using a Smartboard, mark the points (a, slope at a) and see if you can graph the derivative.

2. Next turn on h(x) and x = a. Move the slider.

  • What are you seeing? As you move the slider the dashed vertical line moves to show you where you are. The graph of the derivative is drawn to the left of the dashed line.
  • Once again question the class about what they observe. Notice such things as on intervals where the function increases, the derivative is greater than or equal to zero, etc. Review all the things you discovered in part 1. Remember often students don’t associate things such as “the derivative is negative” with the “graph of the derivative lies below the x-axis.“
  • How does the concavity relate to the graph of the derivative?

3. Now change the starting function to something else.

  • First, just add a constant to f(x). If you really want to get fancy type f(x) = sin(x) + b. A slider for b will appear. Discuss why this transformation does not change the graph of the derivative one bit.
  • Some good examples are f(x) = cos(x), f(x) = x+2sin(x), a third- or fourth-degree polynomial (find a good example in your textbook and see below). Repeat all of steps 1 and 2 above.

Give the students a new function and see if they can sketch the (approximate) graph of the derivative themselves.


For further exploration click the graph below. This is similar to the first one; however, the function is a fourth degree polynomial with variable coefficients. Use the various sliders at the bottom to adjust the graph to an interesting shape. Make p = 0 to graph a cubic and make both p and q zero to graph a parabola. (This might make a good lesson in an advanced math or Algebra 2 class.)

A disclaimer: A function and its derivative should not be graphed on the same axes, because the two have different units. Nevertheless, I have done it here, and it is commonly done everywhere to compare the graphs of a function and its derivatives so that the important features of the two can be lined up and compared easily.

.


Good Question 6: 2000 AB 4

2000 AB 4 Water tankAnother of my favorite questions from past AP exams is from 2000 question AB 4. If memory serves it is the first of what became known as an “In-out” question. An “In-out” question has two rates that are working in opposite ways, one filling a tank and the other draining it.

In subsequent years we saw a question with people entering and leaving an amusement park (2002 AB2/BC2), sand moving on and off a beach (2005 AB 2), another tank (2007 AB2), an oil leak being cleaned up (2008 AB 3), snow falling and being plowed (2010 AB 1), gravel being processed (2013 AB1/BC1), and most recently water again flowing in and out of a pipe (2015 AB1/BC1). The in-between years saw rates in one direction only but featured many of the same concepts.

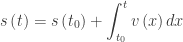
The questions give rates and ask about how the quantity is changing. As such, they may be approached as differential equation initial value problems, but there is an easier way. This easier way is that a differential equation that gives the derivative as a function of a single variable, t, with an initial point \left( {{t}_{0}},y\left( {{t}_{0}} \right) \right) always has a solution of the form

y\left( t \right)=y\left( {{t}_{0}} \right)+\int_{{{t}_{0}}}^{t}{{y}'\left( x \right)dx}.

This is sometimes called the “accumulation equation.” The integral of a rate of change {y}'\left( t \right) gives the net amount of change over the interval of integration [{{t}_{0}},t]. When this is added to the initial amount the result is an expression that gives the amount at any time t.

In a motion context, this same idea is that the position at any time t, is the initial position plus the displacement:

\displaystyle s\left( t \right)=s\left( {{t}_{0}} \right)+\int_{{{t}_{0}}}^{t}{v\left( x \right)dx} where v\left( t \right)={s}'\left( t \right)

The scoring standard gave both forms of the solution. The ease of the accumulation form over the differential equation solution was evident and subsequent standards only showed this one.

2000 AB 4

The question concerned a tank that initially contained 30 gallons of water. We are told that water is being pumped into the tank at a constant rate of 8 gallons per minute and the water is leaking out at the rate of \sqrt{t+1} gallons per minute.

Part a asked students to compute the amount of water that leaked out in the first three minutes. There were two solutions given. The second solves the problem as an initial value differential equation:

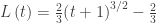
Let L(t) be the amount that leaks out in t minutes then

\displaystyle \frac{dL}{dt}=\sqrt{t+1}

L\left( t \right)=\frac{2}{3}{{\left( t+1 \right)}^{3/2}}+C

L\left( 0 \right)=\frac{2}{3}{{\left( 0+1 \right)}^{3/2}}+C=0 since nothing has leaked out yet, so C = -2/3

L\left( t \right)=\frac{2}{3}{{\left( t+1 \right)}^{3/2}}-\frac{2}{3}

L\left( 3 \right)=\frac{14}{3}

The first method, using the accumulation idea takes a single line:

\displaystyle L\left( 3 \right)=\int_{0}^{3}{\sqrt{t+1}dt}=\left. \frac{2}{3}{{\left( t+1 \right)}^{3/2}} \right|_{0}^{3}=\frac{2}{3}{{\left( 4 \right)}^{3/2}}-\frac{2}{3}{{\left( 1 \right)}^{3/2}}=\frac{14}{3}

I think you’ll agree this is easier and more direct.

Part b asked how much water was in the tank at t = 3 minutes.  We have 30 gallons to start plus 8(3) gallons pumped in and 14/3 gallons leaked out gives 30 + 24 – 14/3 = 148/3 gallons.

This part, worth only 1 point, was a sort of hint for the next part of the question.

Part c asked students to write an expression for the total number of gallons in the tank at time t.

Following part b the accumulation approach gives either

\displaystyle A\left( t \right)=30+8t-\int_{0}^{t}{\sqrt{x+1}dx}  or

\displaystyle A\left( t \right)=30+\int_{0}^{t}{\left( 8-\sqrt{x+1} \right)dx}.

The first form is not a simplification of the second, but rather the second form is treating the difference of the two rates, in minus out, as the rate to be integrated.

The differential equation approach is much longer and looks like this:
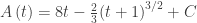
\displaystyle \frac{dA}{dt}=8-\sqrt{t+1}

A\left( t \right)=8t-\frac{2}{3}{{\left( t+1 \right)}^{3/2}}+C

A\left( 0 \right)=30=8(0)-\frac{2}{3}{{\left( 0+1 \right)}^{3/2}}+C, so C=\frac{92}{3}

A\left( t \right)=8t-\frac{2}{3}{{\left( t+1 \right)}^{3/2}}+\frac{92}{3}

Again, this is much longer. In recent years when asking student to write an expression such as this, the directions included a phrase such as “write an equation involving one or more integrals that gives ….” This pretty much leads students away from the longer differential equation initial value problem approach.

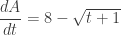
Part d required students to find the time when in the interval 0\le t\le 120 minutes the amount of water in the tank was a maximum and to justify their answer. The usual method is to find the derivative of the amount, A(t), set it equal to zero, and then solve for the time.

{A}'\left( t \right)=8-\sqrt{t+1}

Notice that this is the same regardless of which of the three forms of the expression for A(t) you start with. Thus, an excellent example of the Fundamental Theorem of Calculus used to find the derivative of a function defined by an integral. Or you could just start here without reference to the forms above: the overall rate in the rate in minus the rate out.

{A}'\left( t \right)=0 when t = 63

This is a maximum by the First Derivative Test since for 0 < t < 63 the derivative of A is positive and for 63 < t <120 the derivative of A is negative.

There is an additional idea on this part of the question in the Teaching Suggestions below.


I like this question because it is a nice real (as real as you can hope for on an exam) situation and for the way the students are led through the problem. I also like the way it can be used to compare the two methods of solution.  Then the way they both lead to the same derivative in part d is nice as well. I use this one a lot when working with teachers in workshops and summer institutes for these very reasons.

Teaching Suggestions

  • Certainly, have your students work through the problem using both methods. They need to learn how to solve an initial value problem (IVP) and this is good practice. Additionally, it may help them see how and when to use one method or the other.
  • Be sure the students understand why the three forms of A(t) in part c give the same derivative in part d. This makes an important connection with the Fundamental theorem of Calculus.
  • Like many good AP questions part d can be answered without reference to the other parts. The question starts with more water being pumped in than leaking out. This will continue until the rate at which the water leaks out overtakes the rate at which it is being pumped in. At that instant the rate “in” equals the rate “out” so you could start with 8=\sqrt{t+1}. After finding that t = 63, the answer may be justified by stating that before this time more water is being pumped in than is leaking out and after this time the rate at which water leaks out is greater than the rate at which it is pumped in, so the maximum must occur at t = 63.
  • And as always, consider the graph of the rates.

2000 AB 4

I used this question as the basis of a lesson in the current AP Calculus Curriculum Module entitled Integration, Problem Solving and Multiple Representations © 2013 by the College Board. The lesson gives a Socratic type approach to this question with a number of questions for each part intended to help the teacher not only work through this problem but to bring out related ideas and concepts that are not in the basic question. The module is currently available at AP sponsored workshops and AP Summer Institutes. Eventually, it will be posted at AP Central on the AB and BC Calculus Home Pages.

Discovering the Derivative

Discovering the Derivative with a Graphing Calculator

This is an outline of how to introduce the idea that the slope of the line tangent to a graph can be found, or at least approximated, by finding the slope of a line through two very close points in the graph.  It is a set of graphing calculator activities that will use graphs and numbers to lead to the symbolic form of the derivative.

You may work through the activities with your class (which is what I would do) or you could write and distribute them and let your class do them a laboratory exercise. Before starting students should know how to use their calculator to graph, to trace to points on the graph, and how to save and recall the coordinates from the graph to variables on the home screen using the graphing calculator’s store feature.

I suggest you work through these three times (or more) using different functions. I will work with y={{x}^{2}}. A good second example is y={{x}^{3}}, and a third example to use is y=\sin \left( x \right). Use simple functions, because you will want the students to see the answers without too much trouble.The procedure is the same for all.

Part 1:

  1. Begin by asking students to entery={{x}^{2}} in their calculator asY1 and graph it in a standard, square window. (Do not use the decimal window as “nice” decimals are not necessary or helpful.)

    GC Derivative 1

    Figure 1

  2. Next, have them trace over to different points on the graph (some should go left and others to the right); they should all end up at different points. Then have them zoom-in 6 or 8 times until the graph looks linear. (This is local linearity – functions that are differentiable are locally linear.)
  3. Then push TRACE to be sure the cursor is on the graph. The coordinates of the point are on the bottom of the screen. Go to the HOME screen and save the two values as a and b. Think of this first point as (a, b).
  4. Return to the graph screen and push TRACE. This should return the cursor to the first point. (If not, close is okay.) Then click to the right or to left once, or twice at most, to move to a nearby point on the graph. Return to the home screen and save the new values to c and d for the second point (c, d).
  5. On the home screen use a, b, c, and d to write the slope of the line through the two points. See figure 1. (Go around the room as they are doing this and make sure students are getting this – their slope should be approximately twice a or c.)
  6. Return to the equation screen and enter the equation of the line through the two points asY2. (See figure 2). Graph this equation with the parabola.

    Figure 2

    Figure 2

  7. Have the students record their values of a, b, c, d and m on paper (three decimal places will be enough) and also write a description of what they see on the graph and why they think this is so. (This is in case they lose the numbers on their calculator when they do another graph and also because you will need them later in the next part of the exploration.)

Repeat the same steps separately with the other two functions and record the results in the same way. Write their numbers and observations. Discuss the observations with the class.

  • Of course, the lines should look tangent to the graphs, but since they contain two points of the graph, they cannot actually be tangent.
  • Discuss how a line can be tangent to a graph. How is this different from a tangent to a circle?
  • Ask what could be done to make their line even closer to being tangent. (Use points closer together.)

Part 2:

Now you have homework to do. Collect the student’s data and combine it into a list with columns for a, c, and m. The points do not have to be in order. Leave any “wrong” points for discussion; if there are none, you might want to make one up and include it. Do this for each of the three sets of data. Make a copy for each student. Enter the numbers for a and m as lists in your emulator and make a dot-plot of the points (a, m) = (a, slope at x = a).

  1. Return the lists of points to the students and ask them to study the list and see if they can see any obvious relationship between the numbers on each line. Answers for y = x2 should be the m is approximately twice either a or c; or maybe some will see that m is approximately a + c. Answers for y = x3 will be less obvious (three times the square of a). Answers for y = sin(x) will not be obvious at all.
  2. Using the emulator, separately for each of the three sets of data, make a dot-plot of the numbers (use a square window). Ask the student to discuss what they see. See if they can find an equation of the graph of the dot-plots. Now the equation of the data set for sin(x) should be obvious. Plot their guesses on top of the points and see how close they come.

Part 3:

Now guide the class through the symbolic explanation of what they did. Ask them to explain and write in symbols specifically what they did. The idea here is for you, the teacher, to ask lots of leading questions until the class decides on the best answer.

  1. Call the first point (a, f(a)). Let h = “a little bit.” then the second is the point (a plus a little bit, f(a plus a little bit)) or (a + h, f(a + h)). Recall that h may have been negative for some students so the second point may actually be to the left of the first. Then help them come up with

\displaystyle m\approx \frac{f\left( a+h \right)-f\left( a \right)}{\left( a+h \right)-a}=\frac{f\left( a+h \right)-f\left( a \right)}{h}

Or they may prefer

\displaystyle m\approx \frac{f\left( a \right)-f\left( c \right)}{a-c}

  1. Ask how this could be made “less approximate” and more actually equal. (Answer: smaller and smaller value of h.) Ask them to find the value of h = ac for their points. How small are they? How can you make them really small? (Find a limit.)
  2. Notice that h cannot be zero in these expressions. Keep hinting until someone comes up with the idea of finding

\displaystyle \underset{h\to 0}{\mathop{\lim }}\,\frac{f\left( a+h \right)-f\left( a \right)}{h}  or  \displaystyle \underset{a\to c}{\mathop{\lim }}\,\frac{f\left( a \right)-f\left( c \right)}{a-c}

  1. Next have the students calculate the limits below by actually doing the algebra. (They will not be able to handle the sin(x) at this point so save that for later.)

\displaystyle \underset{h\to 0}{\mathop{\lim }}\,\frac{{{\left( x+h \right)}^{2}}-{{\left( x \right)}^{2}}}{h}\text{ and }\underset{h\to 0}{\mathop{\lim }}\,\frac{{{\left( x+h \right)}^{3}}-{{\left( x \right)}^{3}}}{h}

  1. Compare the answers here with the earlier work and guesses, and discuss.

… And now you are ready to define the limits as the ’(a) derivative of f at x = a.

.

Using AP Questions All Year

This appeared as a reply to a question on the AP Calculus Community bulletin board on August 1, 2015. It has been revised for the blog. 

AP Calculus teachers find it helpful to use actual AP free-response (FR) and multiple-choice (MC) questions on their exams and for homework throughout the year. Early in the year, it is difficult to find or write a free-response style question that can be used for this purpose. This is because FR questions typically cover topics from the entire year – differentiation and integration topics in the same question. This is done to make “the course a cohesive whole rather than a collection of unrelated topics” (to quote the AP Calculus Philosophy statement). Using actual questions helps students will see how disparate topics can be included in one question, but in the beginning of the year you cannot really do that.

Experienced teachers recommend using AP questions throughout the year. They do so by adapting them. This can be done by using only the parts of FR questions that students have studied. They either omit the other parts and adjust the Calculus1points accordingly, or they add new parts on the topics students have studied that can be answered from the same stem, thus going deeper into the topic. At the beginning of the year through mid-year do not be too concerned about copying the style and format of actual AP questions. There will be plenty of time later in the year and during review for that. All year long concentrate on the content and topics in the questions. Add questions to explore the topics in more depth. This is easy to do, since AP questions, by including topics from the entire year, must omit some obvious questions that could be asked using the same stem. My occasional series on “Good Questions” has suggestions and examples on how to do this.

Multiple-choice questions are a little easier to use, since they typically test only one topic. Even here adjustments can be made. Try giving a MC question without the choices – make it a constructed response question and check their work; or leave the choices, require students show their work, and grade it.  Often MC questions can be expanded as well. For an example, see my post Good Question 4.

The person who wrote the original post on the AP Calculus Community was trying to write a question on limits for her first test. I suggested:

As for a limit based FR question see my blog post Good Question 5. This question concerns an AP question from 1998 AB 2. Students were asked in part (a) to find the limits of a function 2x{{e}^{2x}} 
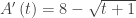
at plus and minus infinity (end behavior). In part (b) they were asked to find the minimum value of the function. At the beginning of the year students won’t know how to do the calculus involved, but you could just give them the minimum or have them graph the function and find the minimum using their graphing calculator. (Yes, I know that’s not allowed on the AP exam, but the point is to use the result in the next two parts of the question). Knowing the minimum, in part (c) students were asked for the range of the function (combining the results of (a) and (b). Then in part (d) students were asked about the minimum of the similar family of functions of the form bx{{e}^{bx}}. This can be answered without using calculus (although using calculus was intended); the blog post will explain how – and some students actually did this on the exam.


.