Quick Notes

Two quick notes:

First, I’ve added a new page with activities and explorations I have collected and used with students and in my summer institutes. Some are formatted as handouts (a/k/a worksheets) and others are black line masters for game type activities. You can find them under the “Resources” tab on the top line menu (direct link). I will be looking through my files for more, so check back now and then. Hope you find them helpful.

Second: last year I reviewed an iPad app called A Little Calculus. This app demonstrates graphically nearly all the concepts of AB and BC Calculus. It is quite easy to use and a quick way to prepare and present good visual examples for your class. Your students may also use it to explore on their own or with directions from you. The app has recently been updated to allow you to save and recall your own examples. This is a helpful improvement allowing you to prepare things in advance or reuse set-ups in later classes. Also, two new topics have been added – Logistic Growth and the Derivative of Exponential Functions. If you are not familiar with it, take a look.

Advertisement

“A Little Calculus”

A Little Calculus is an app for iPad and iPhones. While I don’t usually do product reviews, I think this one is so good that I am making an exception.

There are many good websites that illustrate calculus concepts. Many of them, however, do not allow teachers to enter their own examples; they must use the built-in ones. A Little Calculus is an exception.

A Little Calculus contains over 75 demonstrations of calculus and calculus related concepts, and also three graphing calculators (Cartesian, Parametric, and Polar). Each demonstration can be fully edited to any function and conditions by the user. The topics cover precalculus, limits and continuity, Differential Calculus, Integral Calculus, Sequences and Series, Parametric Curves, and Multivariable Calculus. A full list of the concepts included is at the end of this post. The app is available in the App Store; the price is (only) $0.99. Link.

Each topic has an information screen (circled I in the upper right of the screen) that includes (1) “How To” explaining how to input your example and how to use the features specific to that demonstration. (You should read this the first time you use each topic because some features may not be obvious.), (2) “Background” a textbook-like page that explains in detail the mathematics demonstrated, and (3) “Examples” discussing one or more examples of the concept.

The set-up screen (chevron upper right) allows the user to enter the example they want. This then changes to a pull-down screen. The screenshot below is the set-up screen for “The Area Under a Curve” demonstration. Note the Riemann rectangles available from the set-up screen.

The resulting graph is shown next for 3 right Riemann sum rectangles. By clicking on the “+” or “-“ in the bottom right, you can increase or decrease the number of rectangles one at a time; by holding the “+” sign the number increases rapidly to demonstrate n → ∞. The upper and lower limits may be specified on the set-up screen or be dragged from the graph. The current area of the rectangles is shown in the lower left.

The next illustration shows the “Disk Method” section. The lower graph shows the individual rectangles; the upper shows the 6 rectangles rotated around the line y = –1/2. The “+” button increases the number of rectangles.

This shot shows 150 rectangles; the upper graph has been rotated slightly – this is accomplished in real time by dragging your finger across the screen. All three-dimensional graphs may be moved in this manner.

I could go on …

The one slight drawback is that the input screen does not allow the user to enter parentheses. The parentheses are entered correctly by selecting what is to be enclosed and then tapping the next operation button. This leads to some strange looking expressions such as sin(x)2 instead of (sin(x))2. The expressions are interpreted correctly, but the strange look may confuse some students. It would be easier to type them yourself as usual. Not a big problem.

An effective way to use this app if for the teacher to project a demonstration and discuss the various ideas he or she wishes to discuss. Tapping the screen with two fingers toggles a pointer; this is useful for working on-line with students who cannot see where you are pointing otherwise. Students could use the app to investigate on their own.

UPDATE (August 18,2022) A new feature has been added: you may now save and recall your own example(s) instead of having to reenter them each time. Handy for preparing demonstrations ahead of time or having students prepare their own examples.

Also, two new topics have been added: Logistic growth and the derivative of an exponential function.

Here is a list of the other topics included:


Update 8-18-2022


Comparing the Graph of a Function and its Derivative

The fourth in the Graphing Calculator / Technology series

Comparing the graph of a function and its derivative is instructive and necessary in beginning calculus. Today I will show you how you can do this first with Desmos a free online graphing program and then on a graphing calculator. Desmos does this a lot better than graphing calculators, because of the easy use of sliders. CAS calculators also have sliders but they are not as easy to use as Desmos.

Let’s get started. Instead of presenting you with a completed Desmos graph, I will show you how to make you own. One of the things I have found over the years is that it takes some mathematical knowledge to make good demonstration graph and that in itself if useful and instructive. Hopefully, you and your students will soon be able to make your own to show exactly what you want.

Open Desmos and sign into your account; if you don’t have one then register – its free and you can keep your results and even share them with others.

In the first entry line on the left, enter the equation of  the function whose graph you want to explore. Call it f(x); that is enter f(x) = your function. Later you will be able to change this to other functions and investigate them, without changing anything else.

On the second line enter the symmetric difference quotient as

\displaystyle s\left( x \right)=\frac{f\left( x+0.001 \right)-f\left( x-0.001 \right)}{2\left( 0.001 \right)}

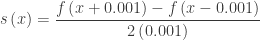
Instead of a variable h, as we did in our last post in this series, enter 0.001. This will graph the derivative without having to calculate the derivative. Of course, you could enter the derivative here if your class has learned how to calculate derivatives. If so, you will have to change this line each time you change the function.

In order to closely compare the function and its derivative, on the next line enter the equation of a vertical segment from a point on the function (a, f(a)) to a point on the derivative (a, s(a)). Desmos does not have a segment operation, but here is how you graph a segment. In general, a segment from (a, b) to (c, d) is entered as the parametric/vector function

\left( a\cdot t+c\cdot \left( 1-t \right),b\cdot t+d\cdot \left( 1-t \right) \right),\ 0\le t\le 1

The a, b, c, and d may be numbers or functions. Since our segment is vertical the first coordinate will have a = c and will reduce to a. Here’s what to enter on the third line:

\left( a,f\left( a \right)\cdot t+s\left( a \right)\cdot \left( 1-t \right) \right)

(Notice that there is no x in this expression; t is the variable. Also, the f(a) and s(a) may be interchanged.)

When you push enter, you will be prompted to add a slider for a: click to add the slider. A line will appear under the expression which will allow you to set the domain for t: click the endpoints and enter 0 on the left and 1 on the right, if necessary.

That’s it. You’re done. Use the slider to move around the graphs.

Using the graphs

Discuss with your class, or better yet divide them into groups and let them discuss, what they see. Since at this point they are probably new to this provide some hints such as “What happens on the graph of  f when s is 0?” or “What is true on s when f is increasing?” or “What happens to the function at the extreme values of the derivative?” Prompt the students to look for increasing and decreasing, concavity, points of inflection, and extreme values. All the usual stuff. Work from the function to the derivative and from the derivative to the function.

Have your students formulate their results as (tentative) theorems.  You actually want them to make some mistakes here, so you can help them improve their thinking and wording. For example, one result might be:  If the function is increasing, then the derivative is positive. By changing the first function to an example like f(x) = x3 or f(x) = x + sin (x). Help them see that non-negative might be a better choice.

You might try giving different groups different functions and let them compare and contrast their results.

This is very much in line with MPACs 1, 2, 4, and 6.

You can do the same kind of thing with graphing calculators. That is, you can graph the function and its derivative or a difference quotient. The difference is that graphing calculators do not have sliders.

Extra feature: Desmos will graph a point if you enter the coordinates just like you write them: (a, b). The coordinates may be numbers or functions or a combination of both. Try adding two points to your graph one at each the end of the segment between the graphs that will move with the same slider.

f(x) = x + 2sin(x) and its derivative.

f(x) = x + 2sin(x) and its derivative.


iPads

At the school where I am teaching this year, all of the students, K – 12, are issued iPads. Whether this is the coming thing in education or not, I cannot say. I like the idea, but then I like technology in teaching and learning. My school issued iPad is my fourth. I offer today a few observations, anecdotal to be sure, for those who are curious about this growing trend.

First, the school owns the iPads. Therefore, the school restricts what apps students can use on them. The school can see what is on each iPad. Students are able to download apps only from the school’s approved list. The school pays for some of the recommended apps. The iPads do not have Apps Store access. The school owns and uses software to make this possible. Students who manage to get around the system are called in and the problem is corrected.

Websites that are not approved are blocked on the school’s server. Students can still access the entire web away from the school.

Yes, the students have games on their iPads, and yes, they try to play them in class. There is also instant messaging and e-mail. The teachers have to keep an eye on what the kids are doing – nothing new about that.

Many of the teachers require students to do their reports and essays using one of the apps available. Students are getting very good at note talking on their machines. Notability (about $3) seems to be the most popular app for this. Even in math classes students can take their notes and do their homework without benefit of paper. Some students e-mail me their homework on days when I collect it.

There are a variety of graphing apps available all of which produce far better graphs than graphing calculators. Good Grapher Pro is my favorite and very easy to use for both 2D and 3D graphs.

Graphing by hand is a problem. Note-taking apps have grid backgrounds, but it is difficult to plot points, and draw lines or curves as neatly as you can on paper.

My calculus classes have access to an electronic copy of their textbook online. It is available anywhere there is internet access. They have a full copy of everything in the text and it looks just like the text. Most of the drawings are animated in the online version – this is a big plus. Also, it is easy to copy an individual problem, say a definite integral, and paste it into Notability or another app and work on it.

My Algebra 1 students do not have an online copy available. They do the next best thing. They photograph the homework page and do their problems from the picture.

It turns out that I am not 100% technology: I still give most of my notes and work the homework problems on a whiteboard. Some students photograph what I write. Then they take the picture home and use it to study from – at least that’s what they tell me. I hope this is a help. I can talk and write on the board much faster than students can write. It seems to me that sometimes note taking can be a distraction. That is, kids are so busy writing down everything that they are not following the flow of ideas.  So, if listening and then taking a picture helps them learn better, I’m all for it.

I also post assignments, worksheets, and so forth online. Students download them to their iPads and always have them handy.

In a previous post I discussed how I use an app called Socrative in my classes.

Please share your experiences with in-class iPad use. Use the “leave a comment” link below.

Socrative

As you may know I have un-retired this year and gone back to high school teaching; I’m filling in for a friend who is on sabbatical. It turns out that this takes a lot of time and so I’ve been writing very little and perhaps neglecting my blog. Today I would like to share a website that I’ve been using this year with both my BC calculus students and my eighth grade Algebra 1 students. It is called Socrative; the URL is www.socrative.com.

The website is similar to a “clicker.” It can be used with a computer, a smart phone, an iPad or other tablet – anything that can connect to the internet. The first time teachers join they get a “room number” that remains theirs from then on. The teacher, working on the teacher side of the site, then prepares quizzes or tests. When the students sign in, they need enter only the teacher’s “room number” and they are ready to go. The teacher starts the quiz, and the students see the questions and answer them on their device. The results are instantly shown on the teacher’s screen.

The questions can be multiple-choice with two (for true-false question) to five choices. Questions may also be open-ended allowing students to enter longer answers. The teacher can supply the correct answer and / or an explanation. Instead of prepared work there is also the option of single-question activities. This is what I use most often. I present the question on the board and the students answer one question at a time on their device.

The results appear on the teacher’s screen which I project for the class. Multiple-choice results are displayed as a bar graph for each choice. Short answers display whatever the student wrote. This allows students to see other forms of the correct answers and spot common mistakes. (Be aware that some students may enter an answer of 2/3 as a forty-place decimal, but that’s not really so bad.)

You have the option to allow the students’ names to appear with their answer. I don’t do that too often. When I do I explain that making fun of someone who made a mistake is a form of bullying and rather they should help whoever got it wrong instead of making fun of them.

Projecting the answers allows the teacher to have immediate feedback – formative assessment. If there are a lot of wrong answers, then you know you have to work more on that concept; if the answers are all or almost all correct you can go on to the next idea.

I used it quite well with eighth grade students in Algebra 1 with all the evaluating of expressions, simplifying, and equation solving in that course and next semester for factoring. I used it recently with my BC calculus classes when we were learning how to write justification for free-response questions. Having a variety of correct and almost correct justifications made for a good discussion and a good class.

Both seniors and eighth graders like doing this and, especially the eighth graders ask to do it daily (which I don’t do).

One of the features I like is that there is a running count of how many students are signed and also how many have answered each question. It helps the teacher know everyone is involved. No one can be daydreaming, doing something else, or playing games on their iPad.

A report with each student’s name and answers can be downloaded at the end of the activity as an e-mail or spreadsheet.

Images, including math symbols, can be included in questions as .gif, .jpg or .png flies, but they are pixellated and appear after the question text (i.e. not as inline equations) and there is no way for students to draw graphs. The website does not work well using Chrome on my PC but is fine in Firefox and Internet Explorer. It works on iPad browsers such as Chrome and Safari. There are also free apps available for smart phones, iPads and tablets.

Far Out!

A monster problem for Halloween.

A while ago I suggested you look at \displaystyle \underset{x\to \infty }{\mathop{\lim }}\,\frac{\ln \left( {{x}^{5}} \right)}{{{x}^{0.02}}} 
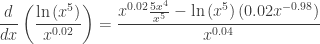
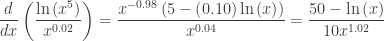
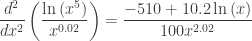
, which using the dominance idea is zero. Of course your students may try graphing or a table. Here’s the graph done by a TI-Nspire CAS. Note the scales.

This is not the way to go. Since the function is increasing near the origin, but the limit at infinity is zero there must be a maximum point where the function starts decreasing. And as the expression can never be negative once x > 1, there must be a point of inflection where the graph becomes concave up and can thereafter approach the x-axis from above as a horizontal asymptote. The maximum can be found by hand which makes for some great algebra manipulation practice:

\displaystyle \frac{d}{dx}\left( \frac{\ln \left( {{x}^{5}} \right)}{{{x}^{0.02}}} \right)=\frac{{{x}^{0.02}}\tfrac{5{{x}^{4}}}{{{x}^{5}}}-\ln \left( {{x}^{5}} \right)\left( 0.02{{x}^{-0.98}} \right)}{{{x}^{0.04}}}

\displaystyle \frac{d}{dx}\left( \frac{\ln \left( {{x}^{5}} \right)}{{{x}^{0.02}}} \right)=\frac{{{x}^{-0.98}}\left( 5-\left( 0.10 \right)\ln \left( x \right) \right)}{{{x}^{0.04}}}=\frac{50-\ln \left( x \right)}{10{{x}^{1.02}}}

Setting this equal to zero and solving gives x={{e}^{50}}\approx 5.185\times {{10}^{21}}

The second derivative is \displaystyle \frac{{{d}^{2}}}{d{{x}^{2}}}\left( \frac{\ln \left( {{x}^{5}} \right)}{{{x}^{0.02}}} \right)=\frac{-510+10.2\ln \left( x \right)}{100{{x}^{2.02}}}

and is zero when x\displaystyle {{e}^{\frac{520}{10.2}}}\approx 1.382\times {{10}^{22}}

Okay, I skipped a few steps here, but you can challenge your students with that. Since we’re really interested in the solution here more than the solving ,this is really a good place to use a CAS calculator.

The first line in the figure above defines the function to save typing it each time. The second line finds the x-coordinate of the maximum point (how do we know this is a maximum?) and the third finds the x-coordinate of the point of inflection.  Much simpler this way!

Take a minute to consider the numbers. They are BIG! In fact, if the units on our graph paper are centimeters, then the maximum point is a little over 5,480 light-years away from the origin! The point of inflection is about 2.665 times farther at more than 14,607 light-years away!

Meanwhile the maximum value is only 91.9699 cm. That’s right centimeters, less than a meter. And the y-coordinate of the point of inflection is about 91.9524 cm. A drop of 0.0175 cm. in a horizontal distance of a little over 9,127 light-years.

Some problems are a lot less scary if done with technology.


The Derivative II

(In this activity I am paraphrasing and expanding the suggestions of Alan Lipp in a posting “Derivatives of Trig Functions” August 29, 2012 to the Calculus Electronic Discussion Group.)

This activity parallels the one in my last post here using technology.

    1. Enter the function you are investigating as Y1 in your calculator. Later you will change this to other functions but will not have to change the following entries.  Start with Y1 = x2.
    2. Enter

      \displaystyle Y2=\frac{Y1(x+0.0001)-Y1(x)}{0.0001}.

      This will approximate the derivative. This expression is called the forward difference quotient.

    1. Graph in a square window.
    1. Guess the equation of the graph you see for Y2, enter you guess in Y3 and graph it. If your guess is correct what should you see?
    1. Deselect Y1 and produce a table for the Y2 and Y3 graph. Do the values of Y2 look like what you guessed for Y3? If not, adjust your guess for Y3. (Hint: because Y2 is an approximation, they will be close but not exact.)
  1. Another way to check your guess is to graph Y4 = Y2/Y3. If your guess is close, Y4 should be the line y = 1. If their guess is wrong, the graph of Y4 may give a clue as to the correct answer. If the guess the derivative of x2 is x, then Y4 = 2 hinting that the correct guess is 2x.

A comment: Calculators have a built in numerical derivative function usually called nDeriv or d/dx. You may use this in step 2 above. However, entering and using the expression for the approximate derivative as above, reinforces the concept and is more transparent for the student than using some strange new built-in function.

Now repeat the exercise above with other functions. Chose functions whose derivatives are easy to guess for example, y = x3, y = x4, y = x5, etc., and  y = sin(x), and y = cos(x).

Keep a list of the results, so you can check it later.