This is the second in my occasional series on good questions, good from the point of view of teaching about the concepts involved. This one is about differential equations and slope fields. The question is from the 2002 BC calculus exam. Question 5. while a BC question, all but part b are suitable for AB classes.
2002 BC 5
The stem presented the differential equation  . Now the only kind of differential equation that AP calculus students are expected to be able to solve are those that can be separated. This one cannot be separated, so some other things must be happening.
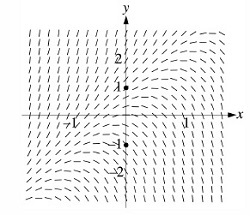
Part a concerns slope fields. Often on the slope field questions students are asked to draw a slope field of a dozen or so points. While drawing a slope field by hand is an excellent way to help students learn what a slope fields is, in “real life” slope fields are rarely drawn by hand. The real use of slope fields is to investigate the properties of a differential equation that perhaps you cannot solve. It allows you to see something about the solutions. And that is what happens in this question.
In the first part of the question students were asked to sketch the solutions that contained the points (0, 1) and (0, –1). These points were marked on the graph. The solutions are easy enough to draw.
But the question did not stop there, as we shall see, using the slope field could help in other parts of the question.
Part c: Taking these out of order, we will return to part b in a moment. Part c told students that there was a number b for which y = 2x + b is a solution to the differential equation. Students were required to find the value of b and (of course) justify their answer.
There are two approaches. Since y = 2x + b is a solution, we can substitute it into the differential equation and solve for b. Since for this solution dy/dx = 2 we have
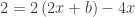
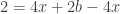

So b = 1 and the solution serves as the justification.
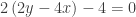
The other method, I’m happy to report, had some students using the slope field. They noticed that the solution through the point (0, 1) is, or certainly appears to be, the line y = 2x + 1. So students guessed that b = 1 and then checked their guess by substituting y = 2x + 1 into the differential equation:


The solution checks and the check serves as the justification.
I like the second solution much better, because it uses the slope field as slope field are intended to be used.
Incidentally, this part was included because readers noticed in previous years that many students did not understand that the solution to a differential equation could be substituted into the differential equation to obtain a true equation as was necessary using either method for part b.
There is yet another approach. Since the solution is given as linear the second derivative must by 0. So


And again b = 1
Returning to part b.
Part b asked students to do an Euler’s method approximation of f(0.2) with two equal steps of the solution of the differential equation through (0, 1). The computation looks like this:


So far so good. But this is is about the solution through the point (0, 1). Again referring to the slope field, there is no reason to approximate (except that students were specifically told to do so). Substituting into y = 2x + 1, f(0.2) = 1.4 exactly!
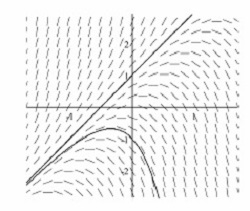
Part d: In the last part of the question students were asked to consider a solution of the differential, g, that satisfied the initial condition g(0) = 0, a solution containing the origin. Students were asked to determine if g(x) had a local extreme at the origin and, if so, to tell what kind (maximum or minimum), and to justify their answer.
Looking again at the slope field it certainly appears that there is a maximum at the origin, and since substituting (0, 0) into the differential equation gives dy/dx = 2(0) – 4(0) = 0, it appears there could be an extreme there. So now how do we determine and justify if this is a maximum or minimum? We cannot use the Candidates’ Test (Closed Interval Test) since we do not have a closed interval, nor can we easily determine if there are any other points nearby where the derivative is zero (there are). Therefore, the First Derivative Test does not help. That leaves the Second Derivative Test.
To use the Second Derivative Test we must use implicit differentiation. (Notice that two unexpected topics now appear extending the scope of the question in a new direction).

At the origin dy/dx = 0 as we already determined, so
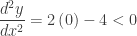
Therefore, since at x = 0, the first derivative is zero and the second derivative is negative the function g(x) has a maximum value at (0, 0) by the Second Derivative Test .
More: Can we solve the differential equation? Yes. The solution has two parts. First we solve the homogeneous differential equation  , ignoring the –4x for the moment. This is easily solved by separating the variables
  , which can be checked by substituting.
Because the differential equation contains x and y and ask ourselves what kind of function might produce a derivative of 2y – 4x? Then we assume there is a solution of the form y = Ax + B where A and B are to be determined and proceed as follows.

Equating the coefficients of the like terms we get the system of equations:


Putting the two parts together the solution is  . This may be checked by substituting. Notice that when C = 0 the particular solution is y = 2x + 1, the line through the point (0, 1).
(Extra: It is not unreasonable to think that instead of y = Ax + B we should assume that the solution might be of the form y = Ax2 + Bx + C. Substitute this into the differential equation and show why this is not the case; i.e. show that A = 0, B = 2 and C = 1 giving the same solution as just found.)
Using a graphing program like Winplot, we can consider all the solutions. Below the slope field is graphed using a slider for C to animate the different solutions. The video below shows this with the animation pausing briefly at the two solutions from part a. Notice the maximum point as the graphs pass through the origin.
But wait! There’s more!
The next post will take this question further – Look for it soon.
Update June 27, 2015. Third solution to part c added.

 and ask them to find the slope of the tangent line (the derivative) where x = 3. No hints, just let them try.


 . To solve for y here is possible but somewhat difficult (Hint: use the quadratic formula). We can continue writing
  for dy/dx.


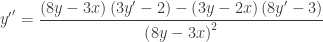
 we differentiate using the quotient rule: