MPAC 5 Notational Fluency

notation-1

MPAC 5: Building notational fluency

Students can:

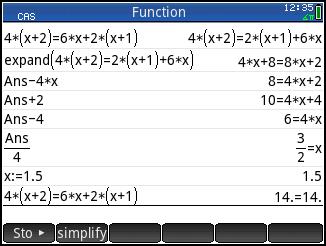
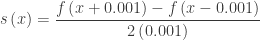
a. know and use a variety of notations (e.g., {f}'\left( x \right),{y}',\frac{dy}{dx});

b. connect notation to definitions (e.g., relating the notation for the definite integral to that of the limit of a Riemann sum);

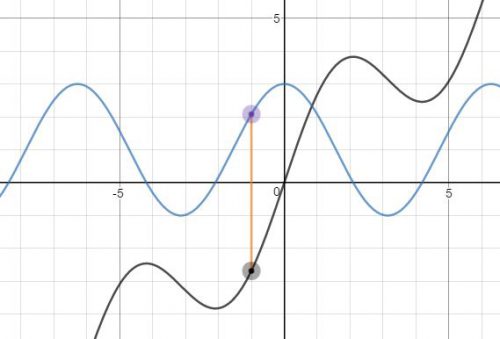
c. connect notation to different representations (graphical, numerical, analytical, and verbal); and

d. assign meaning to notation, accurately interpreting the notation in a given problem and across different contexts.

AP® Calculus AB and AP® Calculus BC Course and Exam Description Effective Fall 2016, The College Board, New York © 2016. Full text is here.

The use of symbols is, not only what everyone thinks of when they think of mathematics, but quite rightly it’s a great tool. Notation has made the abstraction of diverse mathematical concepts possible and revealed the connections between disparate parts of mathematics. Each notation is defined somewhere; the new notations of the calculus are defined during the course (MPAC 5b). Students often do not realize that notation is simply shorthand. Symbols seem to have a magical quality and do things on their own. It is up to the teacher to demystify all this by making the connections listed in this MPAC for the students and making sure students use the notation properly. 

How/where can you make sure students use these ideas in your classes.

The variety of notations and often their redundancy are confusing to students and therefore need to be carefully explained and properly used. This does not begin in calculus, but rather from the first days of students’ mathematical life: the plus sign, +, is notation. Even earlier, 1, 2, 3, are notations. We hope that by the time students get to the calculus they have had a lot of experience with notation and that their teachers have insisted on using notation correctly. The fact that there is often more than one notation for the same thing is recognized in MPAC 5a.

Notation often has meaning related to graphs. For instance, a horizontal asymptote at y = 3 is the graphical manifestation of the expression\underset{x\to \infty }{\mathop{\lim }}\,f\left( x \right)=3.

Notation speeds up communicating (MPAC 6) about what students are doing. For example, given the velocity expression of a moving object and asked to find the acceleration at t = 5.432, all student need to write is a(5.432) = v’(5.432) =  their answer. This not only identifies the answer, but also explains (justifies) what they are doing.

Notation sometimes serves as directions on how to do some process. The Product rule, the Quotient rule and the Chain rule all help us remember what to do when finding derivatives.

But student often misuse notation. A common misuse of notation is to string their computations together with equal signs where that is neither appropriate nor true. They will calculate the integral needed to find the average value over [0,8] and get a decimal answer, say 1034, and then write 1034 = 1034/8 is the average value – correct answer, poor notation, a point lost. Another common mistake is to calculate an area by unwittingly subtracting the upper curve from the lower and get an answer, say –10 and then write –10 = 10. This loses one point for the wrong integrand and another point for the lie –10 = 10. Likewise, saying this integral = |-10| is not correct.

Both examples are incorrect use of the equal sign. Probably the best way to avoid this is to do computation vertically, one line at a time and not connect them with the equal signs. In the first case, had they written

  •     Correct integral = 1034
  •     Average value = 1034/8

They earn full credit. In the second example if they write

  •      Integral lower minus upper = –10     <loses one point>
  •      Area = 10
  •     They not only earn the answer point, but regain (recoup in “reader talk”) the point they lost for the wrong integrand, and earn full credit.

The accurate and precise use of notation is also mentioned in MPAC 6.

When AP exam questions are written the writers reference them to the LOs, EKs and MPACs. The released 2016 Practice Exam given out at summer institutes this summer is in the new format and contains very detailed solutions for both the multiple-choice and free-response questions that include these references. (This version is not available online as far as I know.)  A little more than 1/3 of the multiple-choice and all six free-response questions on both AB and BC exam reference MPAC 5.

Here are some previous posts on these subjects:

A Note on Notation

Definition of the Definite Integral

What is a Solution?

 notation-2


PLEASE NOTE: I have no control over the advertising that appears on this blog. It is provided by WordPress and I would have to pay a great deal to not have advertising. I do not endorse anything advertised here. I noticed that ads for one of the presidential candidates occasionally appears; I certainly do not endorse him.


MPAC 4: Multiple-representations

We used to call it the “Rule of Four.” Maybe that’s why its MPAC 4.

MPAC 4: Connecting multiple representations

Students can:

a. associate tables, graphs, and symbolic representations of functions;

b. develop concepts using graphical, symbolical, verbal, or numerical representations with and without technology;

c. identify how mathematical characteristics of functions are related in different representations;

d. extract and interpret mathematical content from any presentation of a function (e.g., utilize information from a table of values);

e. construct one representational form from another (e.g., a table from a graph or a graph from given information); and

f. consider multiple representations (graphical, numerical, analytical, and verbal) .of a function to select or construct a useful representation for solving a problem.

AP® Calculus AB and AP® Calculus BC Course and Exam Description Effective Fall 2016, The College Board, New York © 2016. Full text is here.

tools_four-actions-frameworkThis is another concept not just of use in the calculus. Students should be using symbols, geometric representations (not just graphs), and numerical ideas along with reading and writing about mathematics from their first days in school.

The symbolic (analytic) aspect of the Rule of Four is perhaps a bit more important in doing mathematics. Things have to be proved analytically. The proper use of symbols in mathematics is the subject of MPAC 5.

The verbal part of the Rule of Four also includes writing and explaining mathematics. This is the subject of MPAC 6.

Technology makes using graphs and table of values very easy. Back in ancient times (that is, in BC – before calculators) when I was in high school getting a graph or a table of values required a lot of work. Now these things are easy and quick when using a calculator; now we can spend our time on what the graphs and numbers mean and what they tell us about the situation we’re investigating.

How/where can you make sure students use these ideas in your classes.

The Rule of Four is definitely not restricted to calculus. Using and relating the parts of the Rule of Four should start way back to the students’ earliest work in mathematics long before Algebra 1. “Graphically” should be expanded to “geometrically;” students should be using drawings and pictures and the like before they learn graphing; and continue to use non-graph representations where appropriate after they learn graphing.

While symbolic or analytic work (working with equations, matrices, etc.) is still where you go when you want to be sure something is true (i.e. to prove things), the others have their place in investigations, in helping to form conjectures, and helping to understanding meaning. By the time they get to the calculus, students should be familiar with looking at functions and other mathematical objects from all four perspectives.

Many problems lend themselves to working with only one or two of the Four. This is natural. While you do not have to force all four aspects into every problem, always consider the others. It is not unusual that one of the other might make things clearer. Students who are required to explain verbally or in writing what they are doing (MPAC 6) will benefit even if that is not strictly required. 

When AP exam questions are written the writers reference them to the LOs, EKs and MPACs. The released 2016 Practice Exam given out at summer institutes this summer is in the new format and contains very detailed solutions for both the multiple-choice and free-response questions that include these references. (This version is not available online as far as I know.)  About 1/4 of the multiple-choice and about ½ of the free-response questions on both AB and BC exam reference MPAC 4.


PLEASE NOTE: I have no control over the advertising that appears on this blog. It is provided by WordPress and I would have to pay a great deal to not have advertising. I do not endorse anything advertised here. I noticed that ads for one of the presidential candidates occasionally appears; I certainly do not endorse him.


How to Tell your Asymptote from a Hole in the Graph.

The fifth in the Graphing Calculator / Technology series

(The MPAC discussion will continue next week)

Seeing discontinuities on a graphing calculator is possible; but you need to know how a calculator graphs to do it. Here’s the story:

The number you choose for XMIN becomes the x-coordinate of the (center of) the pixels in the left most column of pixels. The number you choose for XMAX is the x-coordinate of the right most column of pixels. The distance between XMIN and XMAX is divided evenly between the remaining pixels so that all the pixels are evenly spaced across the screen (the same distance apart). The rows of pixels are done the same way evenly spacing them between YMIN and YMAX.

This spacing is usually not at “nice” values as can be seen by just moving the cursor across the screen and noticing the x-values or y-values at the bottom of the screen.

The cursor is located one pixel to the right of the y-axis and one pixel above the x-axis in the “standard” window of a TI-8x. Note the coordinates of that pixel at the bottom of the screen.

The cursor is located one pixel to the right of the y-axis and one pixel above the x-axis in the “standard” window of a TI-8x. Note the coordinates of that pixel at the bottom of the screen. These are the distances between the pixels.

To draw a graph, the calculator takes the x-coordinate of each pixel, calculates the corresponding y-value and turns on the pixel in that column with closest y-pixel-coordinate. If set in a connect mode, the calculator turns on several pixels in adjacent columns so that the y-values seem to connect; this is why the graph often looks jagged in steep sections of the graph. If you are in DOT mode, this does not happen and only one pixel in each column is on.

If you move the cursor over one of the points on a graph, you will see the pixel coordinates, NOT the actual y-coordinates. Use TRACE to see the actual y-coordinate. This is why when finding intersections, you should not just move the cursor over the point, but rather use “intersect” to see the actual y-value of the function.

If the function is undefined for some x-pixel value, then no pixel will turn on in that column. If the function is undefined for some value between the pixel values, then nothing happens because the calculator has not evaluated the function there, so the graph seems to be continuous.

Vertical “asymptotes” are the result of the calculator not evaluating the function at the undefined value; rather it connects the value on one side of the asymptote off the bottom of the screen with the next value on the other side of the asymptote off the top of the screen. If the asymptote appears exactly at a pixel value, then no “asymptote” will appear and that column of pixels will have no pixel turned on. (Some newer calculators and newer operating systems on older calculators have made adjustments so that the “asymptotes” do not show up. In some systems this feature can be turned on or off.)

The function $latex \displaystyle y=\frac{3\left( x-2 \right)}{\left( x-2 \right)\left( x+2 \right)}$ in the standard window. The vertical line is not really the asymptote and the “hole” at (2, 0.75) is not seen.

The function \displaystyle y=\frac{3\left( x-2 \right)}{\left( x-2 \right)\left( x+2 \right)} in the standard window. The vertical line is not really the asymptote and the “hole” at (2, 0.75) is not seen.

A removable discontinuity, a hole in the graph (really a skipped pixel), can be seen, if it occurs at a pixel value. Since in most examples the hole is at an integer or other “nice” number, you will not see them in the “standard” window. Use a “decimal” window, which has been chosen in advance so the x-values of the pixels are integers and nice decimals. (To see this, in a decimal window move the cursor around and notice the pixel coordinates).

The other thing you can do is adjust the XMIN and XMAX values so that the distance between them will land on integer values. (Nice project for your class – the number of pixels can be found in the guidebook, or you can count them. In the old days, before decimal windows, this was necessary – it was called finding a “friendly window.”)

The function $latex \displaystyle y=\frac{3\left( x-2 \right)}{\left( x-2 \right)\left( x+2 \right)}$ in the “decimal” window. The “asymptote” is not shown and the “hole” at (2, 0.75) is visible.

The function \displaystyle y=\frac{3\left( x-2 \right)}{\left( x-2 \right)\left( x+2 \right)} in the “decimal” window. The “asymptote” has disappeared and the “hole” at (2, 0.75) is now visible.

Zooming in or out may change these values so the hole or asymptote disappears.

For a related idea see the post My Favorite Function


PLEASE NOTE: I have no control over the advertising that appears on this blog. It is provided by WordPress and I would have to pay a great deal to not have advertising. I do not endorse anything advertised here. I noticed that ads for one of the presidential candidates occasionally appears; I certainly do not endorse him.


MPAC 3 Computing

Continuing our look at the Mathematical Practices today we consider computations. We require students to do computations so that they will learn how to do computations; the answer and the check are just the last steps. computing-1

MPAC 3: Implementing algebraic/computational processes

Students can:

a. select appropriate mathematical strategies;

b. sequence algebraic/computational procedures logically;

c. complete algebraic/computational processes correctly;

d. apply technology strategically to solve problems;

e. attend to precision graphically, numerically, analytically, and verbally and specify units of measure; and

f. connect the results of algebraic/computational processes to the question asked.

AP® Calculus AB and AP® Calculus BC Course and Exam Description Effective Fall 2016, The College Board, New York © 2016. Full text is here.

Pretty much all calculus involves computations. This MPAC says that students should be able to plan and carry out the computations necessary to solve problems. This includes selecting the right processes to use and using them correctly. There may be more than one way to do a problem. It includes the use of technology when appropriate as well as the Rule of Four (MPAC 3e). The results should apply to the question asked.

How/where can you make sure students use these ideas in your classes.

Of course you are going to have you students solve problems and investigate mathematical situations, so in some ways this MPAC is “boiler plate.” Students are supposed to learn what to do, in what order to do it, do it correctly, and check or apply their results in the context of the problem.

This applies to the calculus, but starts much earlier. Teachers should be sure that students do this from before day one of Algebra 1. For the teacher it also means checking their work not just for the correct answer, but for the correct thinking and best procedure.

Even many multiple-choice questions involve do a computation. In your classroom exams and quizzes it is a good idea to have students show their work and reasoning on multiple-choice questions. I regularly gave partial credit for good work on multiple-choice questions that required a computation, even if the answer was correct.

CAS calculators and computer programs are great at doing computations, but they still have to be told what to do and in what order to do it. Problems with long or tricky computations are a place to use this technology. For this reason, choosing what to do is, I think, more important than the actual doing it. Still students need to know how to do basic algebra and trigonometry.

CAS calculators can be used to teach basic computation. If a student enters a linear equation and types the operation to solve the equation (such as -4x, or +2) the CAS will perform the operation on both sides of the equation and give the resulting equation. If a student chooses the wrong operation, the CAS does it anyway and presents the result; the student will not see what he or she expected to see and know he or she made a mistake.See the figure in which the fourth line shows a “mistake” followed by a recovery; the last two lines are the check.

Step-by-step solving with a CAS calculator. The fourth line is an intentional mistake. The user not seeing what he expects on the right recovers nicely in the next line. The last two lines are the check.

Step-by-step solving with a CAS calculator. The fourth line is an intentional mistake. The user not seeing what he expects on the right recovers nicely in the next line. The last two lines are the check.

Aside 1: I once had a student in a pre-algebra course who did division by subtracting the divisor from the dividend until he got down to zero. Then he counted the times he subtracted and presented this as the quotient. After all, division is just repeated subtraction. Correct procedure? Yes. Good way to divide? No. His previous teachers were not checking what he did; they loved his correct answers. Alas, I was unable to break him of the habit, and he was not able to go much farther in mathematics.

Aside 2: When scoring the AP exam, every year we see students finding the area of a region by integrating the difference of the upper function subtracted from the lower function and taking the absolute value when they came up with a negative answer. Correct algorithm? Yes. Good way to do the problem? I think not. (They earn full credit for this, if done correctly.)

Aside 3Speaking of computing, I recently learned that my youngest son, who just turned 31 never learned his multiplication tables! Yet, he never had any trouble and could do multiplication as quickly as anyone. So I asked him how he did it. He explained that he worked off the perfect squares. If he had to multiply seven times eight, he thought: seven squared is 49 plus another 7 is 56. I suspect his teacher never asked him to explain how he multiplied. On the other hand, if I were his teacher would I consider this a good way or would I make him memorize the tables? I don’t know; what would you have done?

When AP exam questions are written the writers reference them to the LOs, EKs and MPACs. The released 2016 Practice Exam given out at summer institutes this summer is in the new format and contains very detailed solutions for both the multiple-choice and free-response questions that include these references. (This version is not available online as far as I know.)  About 2/3 of the multiple-choice and all six free-response questions on both AB and BC exam reference MPAC 3.

Well, not really. A photo from a schoolroom in Russia, taken on my vacatin this summer.

Three out of four – could be better.  A photo of a poster in a math schoolroom in Russia, taken on my vacation this summer.

Here is a previous post on this subjects:

While many posts include computations, I do not seem to have any posts on just the idea of doing computations. I offer my euphonious theorem as an example of choosing an unusual computational path through a problem (and leaving the actual computations to the CAS).


PLEASE NOTE: I have no control over the advertising that appears on this blog. It is provided by WordPress and I would have to pay a great deal to not have advertising. I do not endorse anything advertised here. I noticed that ads for one of the presidential candidates occasionally appears; I certainly do not endorse him.


.

MPAC 2 – Connections

steve-jobs-quote-about-creativity-1

-Steve Jobs

Continuing the series on the Mathematical Practices for AP Calculus (MPACs) today we look at MPAC 2.

MPAC 2: Connecting concepts

Students can:

a. relate the concept of a limit to all aspects of calculus;

b. use the connection between concepts (e.g., rate of change and accumulation) or processes (e.g., differentiation and its inverse process, antidifferentiation) to solve problems;

c. connect concepts to their visual representations with and without technology; and

d. identify a common underlying structure in problems involving different contextual situations.

AP® Calculus AB and AP® Calculus BC Course and Exam Description Effective Fall 2016, The College Board, New York © 2016. Full text is here.

While “limit” seems to disappear shortly after the definition of derivative is past and reappears briefly with the definition of the definite integral, in fact all of the calculus depends on limits. Limit seems to be used for other things – continuity, end behavior, asymptotes – but really limit is what makes all of the calculus work and provides the firm foundation for derivatives and integrals and therefore is always in the background of everything calculus. Students need to be made aware of this.

Connecting the concepts in calculus and in previous work in mathematics, seeing the same ideas in different contexts, and using one concept in different ways to solve different type of problems is what makes mathematics in general and the calculus in particular so universal in its application and effectiveness. The ideas in mathematics relate to each other; they are not separate items.

The “Rule of Four” helps students see and understand these connections; technology makes the Rule of Four easy to apply in multiple situations.

How/where can you make sure students use these ideas in your classes.

All the way through the teaching and learning of mathematics these connections exist. Teachers need not only to be aware of them but be sure to point them out to students. Whenever there is an equation, discuss what it means in the context of the problem, see what its graph tells you, and, when a new use comes up, relate it to the previous applications. This is not intended as a way to address different learning styles. The Rule of Four approach is for all students – some will see the idea better on way or the other, but all students will benefit from seeing the connections and the various approaches.

The MPACs overlap with each other. Building notational fluency (MPAC 5), attending to the proper implication of algebraic and computational processes (MPAC 3), connecting multiple representations (The Rule of Four, MPAC 4), proper reasoning (MPAC 1), and communicating the ideas (MPAC 6) all lead to connecting the concepts.

steve-jobs-quote-about-creativity-2

When AP exam questions are written the writers reference them to the LOs, EKs and MPACs. The released 2016 Practice Exam given out at summer institutes this summer is in the new format and contains very detailed solutions for both the multiple-choice and free-response questions that include these references. (This version is not available online as far as I know.) About 40% of the multiple-choice and all six free-response questions on both AB and BC exam reference MPAC 2.

Here are some previous posts om these topics

Limits

Examples of connecting the concepts of graphing functions and linear motion problems


PLEASE NOTE: I have no control over the advertising that appears on this blog. It is provided by WordPress and I would have to pay a great deal to not have advertising. I do not endorse anything advertised here. I noticed that ads for one of the presidential candidates occasionally appears; I certainly do not endorse him.


.

MPAC 1 Reasoning

My series on calculator/technology use will continue during the year. Meanwhile, today I am starting a short series about Mathematical Practices for AP Calculus or MPACs as they are called.

Earlier this year I did some work verifying the alignment of several textbooks to the Essential Knowledge (EK), Learning Objectives (LO), and MPACs of the new Course and Exam Description for AP Calculus. The publishers provided a reference (page or exercise number) for each LO and EK in their books and a separate reference for each MPAC. The books I looked at all hit the LOs and EKs pretty well at over 95%. But the MPACs, not so much.

The MPACs are intended to get students thinking and working like mathematicians. The more I look at them, the more I think they can do that.

Each MPAC starts with the statement “Students should ….” It’s easy for authors to do a good job explaining the calculus in the LOs and EKs; that’s what authors do. The writers do what’s listed in the MPACs because they are good mathematical practices and the authors are good mathematicians, but the authors do not often point out what they are doing in this regard.

The MPACs are for students to do. Textbooks need to provide opportunities for students to do the them. This pretty much has to be in the exercises. Some of the exercises provide the opportunity to do some of the things listed in the MPACs, but this is often more accidental than intended.

Little or no opportunity is intentionally provided to learn and practice the MPACs. It is up to the teachers to provide these opportunities.

While they are called Mathematical Practices for AP Calculus, in fact they really apply to all of mathematics. The calculus examples in the MPACs may easily be changed to apply to mathematics teaching and learning earlier in the curriculum. Properly applied they should have an impact on the entire curriculum. If the goal is to help students learn to think and work like mathematicians, then starting in AP Calculus is way too late.

I will use this and the next few post to discuss the MPACs in detail and provide some suggestions as to where and how teachers can help their students to think and work like mathematicians.

MPAC 1: Reasoning with definitions and theorems

Students can:

a. use definitions and theorems to build arguments, to justify conclusions or answers, and to prove results;

b. confirm that hypotheses have been satisfied in order to apply the conclusion of a theorem;

c. apply definitions and theorems in the process of solving a problem;

d. interpret quantifiers in definitions and theorems (e.g., “for all,” “there exists”);

e. develop conjectures based on exploration with technology; and

f. produce examples and counterexamples to clarify understanding of definitions, to investigate whether converses of theorems are true or false, or to test conjectures.

AP® Calculus AB and AP® Calculus BC Course and Exam Description Effective Fall 2016, The College Board, New York © 2016. Full text is here.

While the word logic does not appear here, these six items (with the possible logic-spockexception of e) are the tools of logic and the basis of mathematical reasoning. The word prove has appeared very rarely on the AP Calculus exams, students have been asked to justify their answers, apply a definition or theorem to a particular function, and show that they know what ideas can be used in a situation and show that they can use them. Conjecturing, producing examples and counterexamples are the basis of mathematical reasoning.

Some suggestions about how and where you can make sure students work with these ideas in your classes.

These items reflect the structure of mathematics. None of the points are specific to the calculus; they can and should be used and developed in all the classes leading up to calculus. Definitions and theorems come into students’ mathematical education before the first year of algebra. The form and structure of axioms, definitions, and theorems, in addition to their meaning, should be made clear to students. So this is something that should start long before calculus and be included every year.

One way you can help students learn how the items in MPAC 1 work is to use True or False (TF) questions; better yet are Always, Sometimes or Never (ASN) questions. These are similar to TF questions except that the students have a middle choice. These questions are an excellent place to hone ones’ skills using the fine points of theorems and definitions. With either TF or ASN questions students should not just answer with a word, but rather be required to explain how they know their answer is correct. They can do this by citing some theorem or definition or producing an example or counterexample. Students can also be asked to discuss, defend, and compare and contrast their answers with other students.

We all know that AP exam questions often require students to “Justify your answer” or “Explain your reasoning.” Here, too, is a good place to practice with the skills of MPAC 1, since justifications and explanations are based on the theorems and definitions

When AP exam questions are written the writers reference them to the LOs, EKs and MPACs. The released 2016 Practice Exam that is in the new format contains very detailed solutions for both the multiple-choice and free-response questions that include these references. About 1/3 of the multiple-choice and all six free-response questions on both AB and BC exam reference MPAC 1.

Here are some previous posts on these subjects:

I have discussed definitions and theorems in previous posts. Here are links to some of them:


PLEASE NOTE: I have no control over the advertising that appears on this blog. It is provided by WordPress and I would have to pay a great deal to not have advertising. I do not endorse anything advertised here. I noticed that ads for one of the presidential candidates occasionally appears; I certainly do not endorse him.


Comparing the Graph of a Function and its Derivative

The fourth in the Graphing Calculator / Technology series

Comparing the graph of a function and its derivative is instructive and necessary in beginning calculus. Today I will show you how you can do this first with Desmos a free online graphing program and then on a graphing calculator. Desmos does this a lot better than graphing calculators, because of the easy use of sliders. CAS calculators also have sliders but they are not as easy to use as Desmos.

Let’s get started. Instead of presenting you with a completed Desmos graph, I will show you how to make you own. One of the things I have found over the years is that it takes some mathematical knowledge to make good demonstration graph and that in itself if useful and instructive. Hopefully, you and your students will soon be able to make your own to show exactly what you want.

Open Desmos and sign into your account; if you don’t have one then register – its free and you can keep your results and even share them with others.

In the first entry line on the left, enter the equation of  the function whose graph you want to explore. Call it f(x); that is enter f(x) = your function. Later you will be able to change this to other functions and investigate them, without changing anything else.

On the second line enter the symmetric difference quotient as

\displaystyle s\left( x \right)=\frac{f\left( x+0.001 \right)-f\left( x-0.001 \right)}{2\left( 0.001 \right)}

Instead of a variable h, as we did in our last post in this series, enter 0.001. This will graph the derivative without having to calculate the derivative. Of course, you could enter the derivative here if your class has learned how to calculate derivatives. If so, you will have to change this line each time you change the function.

In order to closely compare the function and its derivative, on the next line enter the equation of a vertical segment from a point on the function (a, f(a)) to a point on the derivative (a, s(a)). Desmos does not have a segment operation, but here is how you graph a segment. In general, a segment from (a, b) to (c, d) is entered as the parametric/vector function

\left( a\cdot t+c\cdot \left( 1-t \right),b\cdot t+d\cdot \left( 1-t \right) \right),\ 0\le t\le 1

The a, b, c, and d may be numbers or functions. Since our segment is vertical the first coordinate will have a = c and will reduce to a. Here’s what to enter on the third line:

\left( a,f\left( a \right)\cdot t+s\left( a \right)\cdot \left( 1-t \right) \right)

(Notice that there is no x in this expression; t is the variable. Also, the f(a) and s(a) may be interchanged.)

When you push enter, you will be prompted to add a slider for a: click to add the slider. A line will appear under the expression which will allow you to set the domain for t: click the endpoints and enter 0 on the left and 1 on the right, if necessary.

That’s it. You’re done. Use the slider to move around the graphs.

Using the graphs

Discuss with your class, or better yet divide them into groups and let them discuss, what they see. Since at this point they are probably new to this provide some hints such as “What happens on the graph of  f when s is 0?” or “What is true on s when f is increasing?” or “What happens to the function at the extreme values of the derivative?” Prompt the students to look for increasing and decreasing, concavity, points of inflection, and extreme values. All the usual stuff. Work from the function to the derivative and from the derivative to the function.

Have your students formulate their results as (tentative) theorems.  You actually want them to make some mistakes here, so you can help them improve their thinking and wording. For example, one result might be:  If the function is increasing, then the derivative is positive. By changing the first function to an example like f(x) = x3 or f(x) = x + sin (x). Help them see that non-negative might be a better choice.

You might try giving different groups different functions and let them compare and contrast their results.

This is very much in line with MPACs 1, 2, 4, and 6.

You can do the same kind of thing with graphing calculators. That is, you can graph the function and its derivative or a difference quotient. The difference is that graphing calculators do not have sliders.

Extra feature: Desmos will graph a point if you enter the coordinates just like you write them: (a, b). The coordinates may be numbers or functions or a combination of both. Try adding two points to your graph one at each the end of the segment between the graphs that will move with the same slider.

f(x) = x + 2sin(x) and its derivative.

f(x) = x + 2sin(x) and its derivative.