Asymptotes and the Derivative

What does an asymptote of the derivative tell you about the function? How do asymptotes of a function appear in the graph of the derivative?

One of my most read posts is Reading the Derivative’s Graph, first published seven years ago. The long title is “Here’s the graph of the derivative; tell me about the function.” It tells how to quickly find information about the graph of a function from the derivative’s graph. I received a question from a reader recently that asked about asymptotes and the derivative, a topic that I did not cover in that post. So, I tried to find the relationship. The short answer is that an asymptote of the derivatives does not tell you much about the graph of the function. (This is probably why the idea has never been tested on the AP Calculus Exams.)

Nevertheless, there is some calculus to be learned here. You may be able to find some questions for your students to investigate on this topic. Here’s what i determined.

Before we start, here are two terms that are useful, but not commonly used.

  • An even vertical asymptote is one for which the function increases or decreases without limit on both sides of the asymptote. In other words, as x approaches a the function approaches infinity or negative infinity from both sides. The function f\left( x \right)=\frac{1}{{{{{\left( {x-2} \right)}}^{2}}}} has an even vertical asymptote at x = 2. (Figure 1)
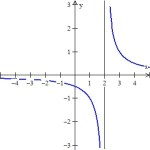
  • An odd vertical asymptote is one for which the function increases without bound on one side and decreases without bound on the other. The function g\left( x \right)=\frac{1}{{x-2}} has an odd vertical asymptote at x = 2. (Figure 2) Likewise, the tangent, cotangent, secant, and cosecant functions have odd vertical asymptotes.

If a function has an odd vertical asymptote, then its derivative will have an even vertical asymptote. (Ask your students to explain why.)

If a function has an even vertical asymptote, then its derivative will have an odd vertical asymptote. (Ask your students to explain why.)

The converses of these two statements are false. That is, a vertical asymptote of the derivative does not necessarily indicate an asymptote of the function. The catch is continuity.

Continuous Functions

If the derivative exists at xa, then the function is continuous there. But, since we are considering asymptotes of the derivative, we cannot know from the derivative alone if the function is continuous where the derivative has an asymptote.

A simple cusp is a situation in which at an extreme point the graph is tangent to a vertical line. See Figure 3. (Or, you could say, the tangent lines from each side are coincident. Here we will limit the discussion to a vertical tangent line.) A continuous function that has a cusp will show an odd vertical asymptote on its derivative’s graph. 

An example is\displaystyle h\left( x \right)=\sqrt[3]{{{{{\left( {x-2} \right)}}^{2}}}}+1  that has a cusp at the point (2,1). (Figure 3).

A continuous function that has a vertical tangent line not a cusp, has an even vertical asymptote on its derivative’s graph. For example, k\left( x \right)={{\left( {x-2} \right)}^{{1/3}}}+1 at (2,0) (Figure 4).

If you are given the graph of the derivative and it shows a vertical asymptote at x = a, and you know the function is continuous there, then

  • an odd vertical asymptote of the derivative indicates cusp on the graph of the function. This will also be an extreme value. (Ask your students to explain why.)
  • an even vertical asymptote of the derivative indicates vertical tangent line on the graph of the function, but not an extreme value. (Ask your students to explain why.)

Other than these, there is no easy way to tell what situation produced an asymptote on the derivative.

Functions that are not continuous

If the function is not continuous at xa, then things get a lot more complicated.

  • If the function is not continuous at x = a, then an even vertical asymptote of the derivative may indicate an odd vertical asymptote on the graph of the function. There is no way to be sure.
  • If the function is not continuous at x = a, then an odd vertical asymptote of the derivative may indicate an even vertical asymptote on the graph of the function. There is no way to be sure.

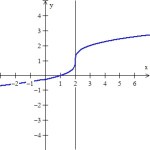
Consider this function: \displaystyle z\left( x \right)=\left\{ {\begin{array}{*{20}{c}} {\sqrt[3]{{{{{\left( {x-2} \right)}}^{2}}}}-1} & {x<2} \\ {\sqrt[3]{{{{{\left( {x-2} \right)}}^{2}}}}+1} & {x\ge 2} \end{array}} \right.

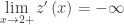
See Figure 5. The function is defined for all Real numbers and has a jump discontinuity at x = 2. The derivative has an odd vertical asymptote there:
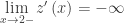
 \displaystyle \underset{{x\to 2-}}{\mathop{{\lim }}}\,{z}'\left( x \right)=-\infty and \displaystyle \underset{{x\to 2+}}{\mathop{{\lim }}}\,{z}'\left( x \right)=-\infty . Compare this with h(x) above.

In fact,\displaystyle {h}'\left( x \right)={z}'\left( x \right)=\tfrac{2}{3}{{\left( {x-2} \right)}^{{-1/3}}},x\ne 2. Go figure.

For considerations of horizontal asymptotes and the derivative see Other Asymptotes 


Type 3 Questions: Graph and Function Analysis

The long name is “Here’s the graph of the derivative, tell me things about the function.”

Students are given either the equation of the derivative of a function or a graph identified as the derivative of a function but no equation is given. It is not expected that students will write the equation (although this may be possible); rather, students are expected to determine important features of the function directly from the graph of the derivative. They may be asked for the location of extreme values, intervals where the function is increasing or decreasing, concavity, etc. They may be asked for function values at points.

The graph may be given in context and student will be asked about that context. The graph may be identified as the velocity of a moving object and questions will be asked about the motion. See Type 2 questions – Linear motion problems

Less often the function’s graph may be given and students will be asked about its derivatives.

What students should be able to do:

  • Read information about the function from the graph of the derivative. This may be approached by derivative techniques or by antiderivative techniques.
  • Find and justify where the function is increasing or decreasing.
  • Find and justify extreme values (1st and 2nd derivative tests, Closed interval test aka.  Candidates’ test).
  • Find and justify points of inflection.
  • Find slopes (second derivatives, acceleration) from the graph.
  • Write an equation of a tangent line.
  • Evaluate Riemann sums from geometry of the graph only.
  • FTC: Evaluate integral from the area of regions on the graph.
  • FTC: The function, g(x), maybe defined by an integral where the given graph is the graph of  the integrand, f(t), so students should know that if,  \displaystyle g\left( x \right)=g\left( a \right)+\int_{a}^{t}{f\left( t \right)dt} then  {g}'\left( x \right)=f\left( x \right)  and  {{g}'}'\left( x \right)={f}'\left( x \right). In this case students should write {g}'(t)=f\left( t \right) on their answer paper, so it is clear to the reader that they understand this.

Not only must students be able to identify these things, but they are usually asked to justify their answer and reasoning. See Writing on the AP Exams for more on justifying and explaining answers.

The ideas and concepts that can be tested with this type question are numerous. The type appears on the multiple-choice exams as well as the free-response. Between multiple-choice and free-response this topic may account for 15% or more of the points available on recent tests. It is very important that students are familiar with all the ins and outs of this situation.

As with other questions, the topics tested come from the entire year’s work, not just a single unit. In my opinion many textbooks do not do a good job with integrating these topics, so be sure to use as many actual AP Exam questions as possible. Study past exams; look them over and see the different things that can be asked.

For some previous posts on this subject see October 1517192426 (my most read post), 2012 and  January 2528, 2013

Free-response questions:

  • Function given as a graph, questions about its integral (so by FTC the graph is the derivative): 2014 AB 3/BC 3, 2016 AB 3/BC 3
  • Table and graph of function given, questions about related functions: 2017 AB 6,
  • Derivative given as a graph: 2016 AB 3 and 2017 AB 3
  • Information given in a table 2014 AB 5

Multiple-choice questions from non-secure exam. Notice the number of questions all from the same year; this is in addition to one free-response question (~25 points on AB and ~23 points on BC out of 108 points total)

  • 2012 AB: 2, 5, 15, 17, 21, 22, 24, 26, 76, 78, 80, 83, 82, 84, 85, 87
  • 2012 BC 3, 11, 12, 15, 12, 18, 21, 76, 78, 80, 81, 84, 88, 89

A good activity on this topic is here. The first pages are the teacher’s copy and solution. Then there are copies for Groups A, B, and C. Divide your class into 3 or 6 or 9 groups and give one copy to each. After they complete their activity have the students compare their results with the other groups.


Corrections made 4-11-2019

Revised March 12, 2021


Graphing – an Application of the Derivative.

Graphing and the analysis of graphs given (1) the equation, (2) a graph, or (3) a table of values of a function and its derivative(s) makes up the largest group of questions on the AP exams. Most of the other applications of the derivative depend on understanding the relationship between a function and its derivatives.

Here is a list of posts on these topics. Since this list is rather long and the topic takes more than a week to (un)cover,

Tangents and Slopes

Concepts Related to Graphs

The Shapes of a Graph 

Open or Closed?  Concerning intervals on which a function increases or decreases.

Extreme Values

Concavity

Joining the Pieces of a Graph

Using the Derivative to Graph the Function

Real “Real life” Graph Reading

Comparing the Graph of a Function and its Derivative  Activities on comparing the graphs using Desmos.

Writing on the AP Calculus Exams   Justifying features of the graph of a function is a major point-earner on the AP Exams.

Reading the Derivative’s Graph Summary and my most read post!


Revised from a post of October 10, 2017


Derivative Applications – Graphing

Graphing and the analysis of graphs given (1) the equation, (2) a graph, or (3) a table of values of a function and its derivative(s) makes up the largest group of questions on the AP exams. Most of the other applications of the derivative depend on understanding the relationship between a function and its derivatives.

Here is a list of posts on these topics. Since this list is rather long and the topic takes more than a week to (un)cover, I will leave it as the lede post for the next two weeks.

Tangents and Slopes

Concepts Related to Graphs

The Shapes of a Graph 

Open or Closed?  Concerning intervals on which a function increases or decreases.

Extreme Values

Concavity

Joining the Pieces of a Graph

Using the Derivative to Graph the Function

Real “Real life” Graph Reading

Comparing the Graph of a Function and its Derivative  Activities on comparing the graphs using Desmos.

Writing on the AP Calculus Exams   Justifying features of the graph of a function is a major point-earner on the AP Exams.

Reading the Derivative’s Graph Summary and my most read post!


Graph Analysis (Type 3)

The long name is “Here’s the graph of the derivative, tell me things about the function.”

Most often students are given the graph identified as the derivative of a function. There is no equation given and it is not expected that students will write the equation (although this may be possible); rather, students are expected to determine important features of the function directly from the graph of the derivative. They may be asked for the location of extreme values, intervals where the function is increasing or decreasing, concavity, etc. They may be asked for function values at points.

The graph may be given in context and student will be asked about that context. The graph may be identified as the velocity of a moving object and questions will be asked about the motion and position. (Type 2)

Less often the function’s graph may be given and students will be asked about its derivatives.

What students should be able to do:

  • Read information about the function from the graph of the derivative. This may be approached by derivative techniques or by antiderivative techniques.
  • Find and justify where the function is increasing or decreasing.
  • Find and justify extreme values (1st and 2nd derivative tests, Closed interval test aka.  Candidates’ test).
  • Find and justify points of inflection.
  • Find slopes (second derivatives, acceleration) from the graph.
  • Write an equation of a tangent line.
  • Evaluate Riemann sums from geometry of the graph only.
  • FTC: Evaluate integral from the area of regions on the graph.
  • FTC: The function, g(x), maybe defined by an integral where the given graph is the graph of  the integrand, f(t), so students should know that if,  \displaystyle g\left( x \right)=g\left( a \right)+\int_{a}^{t}{f\left( t \right)dt} then  {g}'\left( x \right)=f\left( x \right)  and  {{g}'}'\left( x \right)={f}'\left( x \right). In this case students should write {g}'(t)=f\left( t \right) on their answer paper, so it is clear to the reader that they understand this.

Not only must students be able to identify these things, but they are usually asked to justify their answer and reasoning. See Writing on the AP Exams for more on justifying and explaining answers.

The ideas and concepts that can be tested with this type question are numerous. The type appears on the multiple-choice exams as well as the free-response. They have accounted for almost 20% of the points available on recent tests. It is very important that students are familiar with all the ins and outs of this situation.

As with other questions, the topics tested come from the entire year’s work, not just a single unit. In my opinion many textbooks do not do a good job with these topics.

Study past exams; look them over and see the different things that can be asked.

For some previous posts on this subject see October 1517192426 (my most read post), 2012 and  January 2528, 2013


An activity on this topic is here. The first pages are the teacher’s copy and solution. Then there are copies for Groups A, B, and C. Divide your class into 3 or 6 or 9 groups and give one copy to each. After they complete their activity have the students compare their results with the other groups.

Added 4-1-17


Next Posts:

Tuesday March 14: Area and Volume (Type 4)

Friday March 17: Table and Riemann sums (Type 5)

Tuesday Match 21: Differential Equations (Type 6)

Friday March 24: Others (Type 7: related rates, implicit differentiation, etc.)


Is this going to be on the exam?

confused-teacherRecently there was a discussion on the AP Calculus Community bulletin board regarding whether it was necessary or desirable to have students do curve sketching starting with the equation and ending with a graph with all the appropriate features – increasing/decreasing, concavity, extreme values etc., etc. – included. As this is kind of question that has not been asked on the AP Calculus exam, should the teacher have his students do problems like these?

The teacher correctly observed that while all the individual features of a graph are tested, students are rarely, if ever, expected to put it all together. He observed that making up such questions is difficult because getting “nice” numbers is difficult.

Replies ran from No, curve sketching should go the way of log and trig tables, to Yes, because it helps connect f. f ‘ and f ‘’, and to skip the messy ones and concentrate on the connections and why things work the way they do. Most people seemed to settle on that last idea; as I did. As for finding questions with “nice” numbers, look in other textbooks and steal borrow their examples.

But there is another consideration with this and other topics. Folks are always asking why such-and-such a topic is not tested on the AP Calculus exam and why not.

The AP Calculus program is not the arbiter of what students need to know about first-year calculus or what you may include in your course. That said, if you’re teaching an AP course you should do your best to have your students learn everything listed in the 2019 Course and Exam Description book and be aware of how those topics are tested – the style and format of the questions. This does not limit you in what else you may think important and want your students to know. You are free to include other topics as time permits.

Other considerations go into choosing items for the exams. A big consideration is writing questions that can be scored fairly.  Here are some thoughts on this by topic.

Curve Sketching

If a question consisted of just an equation and the directions that the student should draw a graph, how do you score it? How accurate does the graph need to be? Exactly what needs to be included?

An even bigger concern is what do you do if a student makes a small mistake, maybe just miscopies the equation? The problem may have become easier (say, an asymptote goes missing in the miscopied equation and if there is a point or two for dealing with asymptotes – what becomes of those points?) Is it fair to the student to lose points for something his small mistake made it unnecessary for him to consider? Or if the mistake makes the question so difficult it cannot be solved by hand, what happens then? Either way, the student knows what to do, yet cannot show that to the reader.

To overcome problems like these, the questions include several parts usually unrelated to each other, so that a mistake in one part does not make it impossible to earn any subsequent points. All the main ideas related to derivatives and graphing are tested somewhere on the exam, if not in the free-response section, then as a multiple-choice question.

(Where the parts are related, a wrong answer from one part, usually just a number, imported into the next part is considered correct for the second part and the reader then can determine if the student knows the concept and procedure for that part.)

Optimization

A big topic in derivative applications is optimization. Questions on optimization typically present a “real life” situation such as something must be built for the lowest cost or using the least material. The last question of this type was in 1982 (1982 AB 6, BC 3 same question). The question is 3.5 lines long and has no parts – just “find the cost of the least expensive tank.”

The problem here is the same as with curve sketching. The first thing the student must do is write the equation to be optimized. If the student does that incorrectly, there is no way to survive, and no way to grade the problem. While it is fair to not to award points for not writing the correct equation, it is not fair to deduct other points that the student could earn had he written the correct equation.

The main tool for optimizing is to find the extreme value of the function; that is tested on every exam. So here is a topic that you certainly may include the full question in you course, but the concepts will be tested in other ways on the exam.

The epsilon-delta definition of limit

I think the reason that this topic is not tested is slightly different. If the function for which you are trying to “prove” the limit is linear, then \displaystyle \delta =\frac{\varepsilon }{\left| m \right|} 
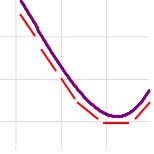
where m is the slope of the line – there is nothing to do beside memorize the formula. If the function is not linear, then the algebraic gymnastics necessary are too complicated and differ greatly depending on the function. You would be testing whether the student knew the appropriate “trick.”

Furthermore, in a multiple-choice question, the distractor that gives the smallest value of must be correct (even if a larger value is also correct).

Moreover, finding the epsilon-delta relationship is not what’s important about the definition of limit. Understanding how the existence of such a relationship say “gets closer to” or “approaches” in symbols and guarantees that the limit exists is important.

Volumes using the Shell Method

I have no idea why this topic is not included. It was before 1998. The only reason I can think of is that the method is so unlike anything else in calculus (except radial density), that it was eliminated for that reason.

This is a topic that students should know about. Consider showing it too them when you are doing volumes or after the exam. Their college teachers may like them to know it.

Integration by Parts on the AB exam

Integration by Parts is considered a second semester topic. Since AB is considered a one-semester course, Integration by Parts is tested on the BC exam, but not the AB exam. Even on the BC exam it is no longer covered in much depth: two- or more step integrals, the tabular method, and reduction formulas are not tested.

This is a topic that you can include in AB if you have time or after the exam or expand upon in a BC class.

Newton’s Method, Work, and other applications of integrals and derivatives

There are a great number of applications of integrals and derivatives. Some that were included on the exams previously are no longer listed. And that’s the answer right there: in fairness, you must tell students (and teachers) what applications to include and what will be tested. It is not fair to wing in some new application and expect nearly half a million students to be able to handle it.

Also, remember when looking through older exams, especially those from before 1998, that some of the topics are not on the current course description and will not be tested on the exams.

Solution of differential equations by methods other than separation of variables

Differential equations are a huge and important area of calculus. The beginning courses, AB and BC, try to give students a brief introduction to differential equations. The idea, I think, is like a survey course in English Literature or World History: there is no time to dig deeply, but the is an attempt to show the main parts of the subject.


While the choices are somewhat arbitrary, the College Board regularly consults with college and university mathematics departments about what to include and not include. The relatively minor changes in the new course description are evidence of this continuing collaboration. Any changes are usually announced two years in advance. (The recent addition of density problems unannounced, notwithstanding.) So, find a balance for yourself. Cover (or better yet, uncover) the ideas and concepts in the course description and if there if a topic you particularly like or think will help your students’ understanding of the calculus, by all means include it.


PS: Please scroll down and read Verge Cornelius’ great comment below.


Happy Holiday to everyone. There is no post scheduled for next week; I will resume in the new year. As always, I like to hear from you. If you have anything calculus-wise you would like me to write about, please let me know and I’ll see what I can come up with. You may email me at lnmcmullin@aol.com


.

Comparing the Graph of a Function and its Derivative

The fourth in the Graphing Calculator / Technology series

Comparing the graph of a function and its derivative is instructive and necessary in beginning calculus. Today I will show you how you can do this first with Desmos a free online graphing program and then on a graphing calculator. Desmos does this a lot better than graphing calculators, because of the easy use of sliders. CAS calculators also have sliders but they are not as easy to use as Desmos.

Let’s get started. Instead of presenting you with a completed Desmos graph, I will show you how to make you own. One of the things I have found over the years is that it takes some mathematical knowledge to make good demonstration graph and that in itself if useful and instructive. Hopefully, you and your students will soon be able to make your own to show exactly what you want.

Open Desmos and sign into your account; if you don’t have one then register – its free and you can keep your results and even share them with others.

In the first entry line on the left, enter the equation of  the function whose graph you want to explore. Call it f(x); that is enter f(x) = your function. Later you will be able to change this to other functions and investigate them, without changing anything else.

On the second line enter the symmetric difference quotient as

\displaystyle s\left( x \right)=\frac{f\left( x+0.001 \right)-f\left( x-0.001 \right)}{2\left( 0.001 \right)}

Instead of a variable h, as we did in our last post in this series, enter 0.001. This will graph the derivative without having to calculate the derivative. Of course, you could enter the derivative here if your class has learned how to calculate derivatives. If so, you will have to change this line each time you change the function.

In order to closely compare the function and its derivative, on the next line enter the equation of a vertical segment from a point on the function (a, f(a)) to a point on the derivative (a, s(a)). Desmos does not have a segment operation, but here is how you graph a segment. In general, a segment from (a, b) to (c, d) is entered as the parametric/vector function

\left( a\cdot t+c\cdot \left( 1-t \right),b\cdot t+d\cdot \left( 1-t \right) \right),\ 0\le t\le 1

The a, b, c, and d may be numbers or functions. Since our segment is vertical the first coordinate will have a = c and will reduce to a. Here’s what to enter on the third line:

\left( a,f\left( a \right)\cdot t+s\left( a \right)\cdot \left( 1-t \right) \right)

(Notice that there is no x in this expression; t is the variable. Also, the f(a) and s(a) may be interchanged.)

When you push enter, you will be prompted to add a slider for a: click to add the slider. A line will appear under the expression which will allow you to set the domain for t: click the endpoints and enter 0 on the left and 1 on the right, if necessary.

That’s it. You’re done. Use the slider to move around the graphs.

Using the graphs

Discuss with your class, or better yet divide them into groups and let them discuss, what they see. Since at this point they are probably new to this provide some hints such as “What happens on the graph of  f when s is 0?” or “What is true on s when f is increasing?” or “What happens to the function at the extreme values of the derivative?” Prompt the students to look for increasing and decreasing, concavity, points of inflection, and extreme values. All the usual stuff. Work from the function to the derivative and from the derivative to the function.

Have your students formulate their results as (tentative) theorems.  You actually want them to make some mistakes here, so you can help them improve their thinking and wording. For example, one result might be:  If the function is increasing, then the derivative is positive. By changing the first function to an example like f(x) = x3 or f(x) = x + sin (x). Help them see that non-negative might be a better choice.

You might try giving different groups different functions and let them compare and contrast their results.

This is very much in line with MPACs 1, 2, 4, and 6.

You can do the same kind of thing with graphing calculators. That is, you can graph the function and its derivative or a difference quotient. The difference is that graphing calculators do not have sliders.

Extra feature: Desmos will graph a point if you enter the coordinates just like you write them: (a, b). The coordinates may be numbers or functions or a combination of both. Try adding two points to your graph one at each the end of the segment between the graphs that will move with the same slider.

f(x) = x + 2sin(x) and its derivative.

f(x) = x + 2sin(x) and its derivative.