Related Rate Problems I

Related rate problems provide an early opportunity for students to use calculus in a more or less, real context and practice implicit differentiation.

One of the problems students have with these problems is that almost all of them involve writing the model or starting equation based on some geometric situation. Students must switch from calculus to geometry and then back again. When starting out, one of the ways to avoid this is to give a few problems that do not involve any geometry. Once they have the idea of relating the rates by using the derivative, then they may be ready to tackle the geometry.

Here are two examples of related rate problems without geometry (answers at the end).

1. The kinetic energy, K in joules, of a moving object is given by the equation K=\tfrac{1}{2}m{{v}^{2}} where m is the mass of the object and v is its velocity. The mass of a rocket decreases at a constant rate of 25 kg/sec due to the burning of its fuel. When the mass of the rocket is 6000 kg, the velocity is 12 m/sec and increases at the rate of 2 m/sec/sec. At this instant how fast is the kinetic energy in changing? (The units are joules / sec.)

2. The force, F in Newtons, of a moving object is given by the equation F=ma where m is the mass of the object and a is its acceleration. A rocket sled is propelled along a track with an acceleration given by a(t)=5{{t}^{2}}+6t\text{ for }t\ge 0. When t = 6 sec. its mass is 10 kg and is decreasing at the rate of 0.2 kg/sec due to the burning of its fuel. At this instant how fast is the force changing?

The next post will be two out of the ordinary related rate problems (with geometry).

Answers:  1. 142,200 joules / sec.  2.   616.8 Newtons / sec

Derivative Practice – Graphs

Another way to practice the derivative rules.

The graph below shows two piecewise defined functions, f and g, each consisting of two line segments.

  1. If h\left( x \right)=2g\left( x \right)-5f\left( x \right) calculate {h}'\left( 3 \right)
  2. If j\left( x \right)=f\left( x \right)g\left( x \right) calculate {j}'\left( -4 \right)
  3. If k\left( x \right)={{x}^{2}}f\left( x \right) calculate {k}'\left( 5 \right)
  4. If  r\left( x \right)=f\left( g\left( x \right) \right)  calculate {r}'\left( 0 \right)
  5. Write the equation of the line tangent to the graph of y=2+f\left( x \right)g\left( x \right) at the point  \left( -4,2 \right).

There are a lot more like these that you can ask from the same graph; or make up your own graph and questions.

Answers:  1. -17/3,     2. 6,     3.  75,     4. -1/3,     5. y = 2 + 6(x + 4)   (Corrected 10-3-12 19:10)

Derivative Practice – Numbers

Here is an example of how to help your students practice their derivative rules in a different way. Tomorrow another different approach.
Let f be a differentiable function. The table below gives values of f and g their first derivatives at selected values of x

x   -2    0   2   4   6
 f\left( x \right) -8 0 –2 2 5
 {f}'\left( x \right)  2  4 –3 –1 0
 g\left( x \right) 2 4 5 6 5
 {g}'\left( x \right) 1 2 4 3  2
    1. If h\left( x \right)=f\left( x \right)+3g\left( x \right) find  {h}'\left( 2 \right)
    2. If \displaystyle j\left( x \right)=\frac{f\left( x \right)}{g\left( x \right)} find  {j}'\left( 4 \right)
    3. If  r\left( x \right)=f\left( g\left( x \right) \right)  find  {r}'\left( 0 \right)
    4. If  s\left( x \right)=g\left( f\left( x \right) \right)  find  {s}'\left( 2 \right)
    5. If  q\left( x \right)=g\left( x \right)f\left( x \right) find  {q}'\left( -2 \right)
    6. Approximate  {g}'\left( 3 \right)
    7. Write an equation of the line tangent to g at the at the point where = 0.

Answers:

1. 9,     2. -1/3,     3. -2,     4. -3,     5. -5,     6. 1/2,    7.  y=4+2(x-0) or y = 4+2

The Mean Value Theorem II

The Rule of Four suggests that mathematics be studied from the analytical, graphical, numerical, and verbal points of view. Proof can only be done analytically – using symbols and equations. Graphs, numbers, and words aid in that, but do not by themselves prove anything.

On the other hand, numbers and especially graphs can make many of the theorems much more understandable and often can convince one of the truth of a theorem far better than the actual proof.

The Mean Value Theorem, MVT, is a good example; it can be demonstrated with a lot less trouble. See the figure above. Picture the blue line connecting the endpoints of the interval (the secant line) moving up, parallel to its original position. See the figure above. As this line moves up it intersects the graph twice, until eventually, just before it does not intersect at all, it comes to a place where it intersects exactly one. At this point it is tangent to the original graph. Since it is tangent, the slope of the line is the same as the derivative, {f}'\left( c \right), at that point.

So, the derivative is equal to the slope of the line between the endpoints. The MVT says that if its hypotheses are true, then there must be a place where the slope of the tangent line is parallel to the slope of the secant line.
But wait, there is more: at that point the instantaneous rate of change of the function is equal to the average rate of change over the interval.

This shows a real strength of looking at the graph.

But it is only one of many possible graphs. The graph could look like this figure:

Here there are several places (5 to be exact) where the tangent line is parallel to the secant line; there could be several on one side, or several on both sides. But this is not a problem; this does not contradict the MVT, which says there is at least one.

Yet another way to show the MVT is this. Near the left end of the first graph above the slope of the tangent to the graph (the derivative) is larger than the slope of the secant line; near the right end the slope of the tangent is less than the slope of the secant. So somewhere in between, by the Intermediate Value Theorem, the slope of the tangent must equal the slope of the secant. (For the purists out there, this is from Darboux’s theorem, and requires a slightly stronger hypothesis, namely that the one-sided derivatives at a and b exist.)

Rolle’s theorem can be demonstrated with either of these approaches as well. Rolle’s Theorem is really a special case of the MVT where the slope of the secant line is zero.

In conclusion, I think that this sequence of theorems is a good place to do a little proving of theorems. On the other hand you can easily show the results other ways. In fact, the method at the beginning of this post should be shown anyway in order to give students a good picture (no pun intended) of the MVT. It will help them remember what it is all about.

The Mean Value Theorem I

The Mean Value Theorem says that if a function, f , is continuous on a closed interval [a, b] and differentiable on the open interval (a, b) then there is a number c in the open interval (a, b) such that

\displaystyle {f}'\left( c \right)=\frac{f\left( b \right)-f\left( a \right)}{b-a}.

It says a lot more than that which we will consider in the next post.

The proof, which once you know where to start, is straight forward and rests on Rolle’s theorem.

In the figure above we see the graph of f and the graph of the (secant) line, y (x), between the endpoints of f. we define a new function h(x) = f (x) – y (x), this is the vertical distance from f to y. The equation of the line is in the figure and so

\displaystyle f\left( x \right)-f\left( a \right)-\frac{f\left( b \right)-f\left( a \right)}{b-a}\left( x-a \right)=h\left( x \right)

The function h meets all the conditions of Rolle’s theorem. In particular, h (a) = h (b) = 0 since at the endpoint the two graphs intersect and the distance between them is zero. You can also verify this by substituting first x = a and then x = b into h. Therefore, by Rolle’s theorem there is a number x = c between a and b such that {h}'\left( c \right)=0. So we’ll find the derivative and substitute in x = c.

\displaystyle {f}'\left( x \right)-0-\frac{f\left( b \right)-f\left( a \right)}{b-a}={h}'\left( x \right)

\displaystyle {f}'\left( c \right)-\frac{f\left( b \right)-f\left( a \right)}{b-a}=0

\displaystyle {f}'\left( c \right)=\frac{f\left( b \right)-f\left( a \right)}{b-a}

This last equation is very important and will come back in the second act and elsewhere.

So again, we see how one theorem, Rolle’s, leads to another, the MVT.

The arc from the definition of derivative, through Fermat’s theorem and Rolle’s theorem to the MVT is, I think, a good way to demonstrate how theorems and their proofs work together. Since I would not like my students not to have any familiarity with proof and definition, I think this is a good place to show them just a little of what it’s all about.

On the other hand, we have ended up with a strange equation, which apparently has something to do with mean value, whatever that is. In the final post in this series we will discuss what this all means and how to convince your students of the truth of the MVT without all the symbol pushing that’s required in a proof.

I don’t like this proof because you must know to set up the function h at the beginning. It is “legal” to do that, but how do you know to do it? On the other hand, doing things like that is something that has to be done sometimes and students need to know this too. But we’ll see an easier way in the next post.

Rolle’s Theorem

Rolle’s theorem says that if a function is continuous on a closed interval [a, b], differentiable on the open interval (a, b) and if f (a) = f (b), then there exists a number c in the open interval (a, b) such that {f}'\left( c \right)=0
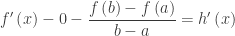
.  (“There exists a number” means that there is at least one such number; there may be more than one.)

The proof has two cases:

Case I: The function is constant (all of the values of the function are the same as f (a) and f (b)). The derivative of a constant is zero so any (every, all) value(s) in the open interval qualifies as c.

Case II: If the function is not constant then it must have a maximum or minimum in the open interval (a, b) by the Extreme Value Theorem. So, by Fermat’s theorem (see this post) the derivative at that point must be zero.

So, Fermat’s theorem makes Rolle’s theorem a piece of cake.

A lemma is a theorem whose result is used in the next theorem and makes it easier to prove. So Fermat’s theorem is a lemma for Rolle’s theorem.

On the other hand, a corollary is a theorem is a result (theorem) that follows easily from the previous theorem. So, Rolle’s theorem could also be called a corollary of Fremat’s theorem.

Rolle’s theorem makes a major appearance in the MVT and then more or less disappears from the stage. When you find critical number or critical points you are using Fermat’s theorem.

I like this proof because it’s so simple. It really just comes immediately from Fermat’s theorem.

The next post: The Mean Value Theorem.

Fermat’s Penultimate Theorem

I have mixed feelings about proof in high school math and high school calculus. I am not one for proving everything. For one thing, it cannot be done and, if it could be done, proof would become the whole focus of high school math. Proofs are not the focus of first-year calculus or AP calculus. The place for proving “everything” is a real analysis course in college.

However, students should know about proof and there are places where you can demonstrate some of the power of proof and show how proof works in calculus.
It is important, I think, that students know why a theorem is true; this helps in understanding what the theorem means. Some, but by no means all, proofs can show the student why the theorem is true. With other theorems there may be easier ways than a proof to convince someone of its truth.

In this and the next three posts, I propose to look at three theorems, the definitions used in them, and the ideas in their proofs. These are the theorems that lead up to the Mean Value Theorem (MVT). The MVT is a major result in calculus has many uses. Here goes:

Fermat’s theorem (not his famous “last” theorem, but an earlier one) says, that if a function is continuous on a closed interval and has a maximum (or minimum) value on that interval at x = c, then the derivative at x = c is either zero or does not exist.

The proof goes like this:
There are two cases. In each case we will look at the limit of the difference quotient that defines the derivative at x = c, namely, \frac{f\left( c+h \right)-f\left( c \right)}{h} and look at what happens as h approaches 0 from the left and from the right. These two limits are the same and equal to the derivative if, and only if, the derivative at c exists.

Also note that since we are assuming f(c) is a maximum, f (c) ≥ f (c + h) regardless of whether h is positive or negative. The numerator of the difference quotient is always zero or negative. Then if in the denominator h < 0, the quotient is non-positive; likewise, if h > 0, the quotient is non-negative.

Case I: The two limits are not equal. In this case the derivative does not exist. This could occur with a piecewise function, where two pieces with different derivatives meet at x = c.

Case II: The limits are equal. In this case the limit from the left (h < 0) must be greater than or equal to zero (since the function is increasing there) and the limit from the right (h > 0) must be less than or equal to zero. Then, the only way the limits can be equal is if both limits are zero; therefore the derivative is zero.

Any place where the derivative of a continuous function is zero or undefined is called a critical point and the number c is called a critical number (new definitions).

I think this proof is interesting because while there are lots of symbols flying around the key is interpreting what kind of number (positive, zero or negative) the symbols represent. Another thing I like is having to “read” the symbols and see that f\left( c+h \right)\le f\left( c \right) and therefore f\left( c+h \right)-f\left( c \right)\le 0

The next post will discuss Rolle’s theorem.