Percentages Don’t Make the Grade

Well, the AP exams have been written and the dust has settled. Folks are posting their answers on the Community Bulletin Boards. (I never post mine – too many mistakes.) The other thing that always gets discussed at this time of year is whether this year’s exam is more difficult or less difficult than last year’s.

I am sure this year’s was more difficult or less difficult than last year’s because it is impossible to make two exams of the same difficulty.

But it doesn’t matter.

The grades will reflect, as best as possible, that a student knows as much calculus as students with the same score did last year. That’s the important thing.

Because it is impossible for anyone or any group to make two exams of the same difficulty, percentages tell you nothing. The percentage of the number of points that a student earns out of the number possible tells you just that and nothing more. If the tests are not of the exact same difficulty, then percentages are meaningless.

What to do?

The Educational Testing Service (ETS) who writes and administers the AP exams for the College Board carefully pretests each question. Also, there are a number of questions from last year’s exam on this year’s exam. These questions, called equators, allow ETS to judge the difficulty of the other questions on this year’s exam compared to last year’s. It allows them to judge the ability of this year’s student cohort compared to last year’s. Each question is considered individually. Questions that score poorly or questions that identifiable groups of students do far worse compared to the entire group taking the test are not counted in the final score. (For example, in 2008 question AB 19 was not counted; too many missed it.) They compare the results of questions within each exam. With this information they “scale” the exams and decide on the cut points, the high and low raw scores that earn a 5, 4, 3, 2, or 1.

A teacher on a day-to-day basis cannot do so detailed an analysis. Yet we still need to give students grades. We need to scale the exams.  I was quite happy this year using a scheme Dan Kennedy suggested some years ago (see resources tab above). This worked quite well for me in BC Calculus and in 8th grade Algebra 1. Perhaps you have another system.

Percentages just don’t make the grade.

Update September 22, 2014: Matthew Braddock, Mathematics Instructor & Webmaster, at the Dr. Henry A. Wise, Jr., High School in Prince George’s County, Maryland sent me a GeoGebra applet that will calculate the grades using Dan Kennedy’s scheme described in the link above. It runs at a website so you do not need GeoGebra on your computer or iPad to use it. Simply enter the information and it will do the rest. Thank you Matthew. 

Update December 3, 2018. The link above is no longer active. This link is to a similar app by Dan Anderson on Desmos. Thank you Dan. For more on this scaling test see the post: On Scaling.


Updated: September 22,2014, Kennedy link fixed February 9, 2018


Getting Ready for the AP Exams

Another month and it will be time to start reviewing for the AP exams. The exams this year are on Wednesday morning May 7, 2014.

To help you plan ahead, below are links to previous posts specifically on reviewing for the exam and on the type questions that appear on the free-response sections of the exams. I try to review by topic spending 1-2 days on each so that students can see the things that are asked for each general type. Many of the same ideas are tested in smaller “chunks” on the multiple-choice sections, so looking at the type should help with not only free-response questions but many of the multiple-choice questions as well. Of course, I will also spend some time on just multiple-choice questions as well.

February 25, 2013: Ideas for Reviewing for the AP Calculus Exams

February 25, 2013: The AP Calculus Exams

February 27, 2013: Interpreting Graphs AP Type Questions 1

March 2, 2013: The Rate/Accumulation Question AP Type Question 2 

March 4, 2013: Area and Volume Questions AP Type Question 3

March 6, 2013: Motion on a Line AP Type Question 4

March 8, 2013: The Table Question AP Type Question 5 

March 10, 2013: Differential Equations AP Type Question 6 

March 15, 2013: Implicit Relations and Related Rates AP Type Question 7 

March 15, 2013: Parametric and Vector Equations AP Type Question 8 (BC)

March 18, 2013: Polar Curves AP Type Question 9 (BC)

March 20, 2013: Sequences and Series AP Type Question 10 (BC)

March 22, 2013: Calculator Use on the AP Exams (AB & BC)

iPads

At the school where I am teaching this year, all of the students, K – 12, are issued iPads. Whether this is the coming thing in education or not, I cannot say. I like the idea, but then I like technology in teaching and learning. My school issued iPad is my fourth. I offer today a few observations, anecdotal to be sure, for those who are curious about this growing trend.

First, the school owns the iPads. Therefore, the school restricts what apps students can use on them. The school can see what is on each iPad. Students are able to download apps only from the school’s approved list. The school pays for some of the recommended apps. The iPads do not have Apps Store access. The school owns and uses software to make this possible. Students who manage to get around the system are called in and the problem is corrected.

Websites that are not approved are blocked on the school’s server. Students can still access the entire web away from the school.

Yes, the students have games on their iPads, and yes, they try to play them in class. There is also instant messaging and e-mail. The teachers have to keep an eye on what the kids are doing – nothing new about that.

Many of the teachers require students to do their reports and essays using one of the apps available. Students are getting very good at note talking on their machines. Notability (about $3) seems to be the most popular app for this. Even in math classes students can take their notes and do their homework without benefit of paper. Some students e-mail me their homework on days when I collect it.

There are a variety of graphing apps available all of which produce far better graphs than graphing calculators. Good Grapher Pro is my favorite and very easy to use for both 2D and 3D graphs.

Graphing by hand is a problem. Note-taking apps have grid backgrounds, but it is difficult to plot points, and draw lines or curves as neatly as you can on paper.

My calculus classes have access to an electronic copy of their textbook online. It is available anywhere there is internet access. They have a full copy of everything in the text and it looks just like the text. Most of the drawings are animated in the online version – this is a big plus. Also, it is easy to copy an individual problem, say a definite integral, and paste it into Notability or another app and work on it.

My Algebra 1 students do not have an online copy available. They do the next best thing. They photograph the homework page and do their problems from the picture.

It turns out that I am not 100% technology: I still give most of my notes and work the homework problems on a whiteboard. Some students photograph what I write. Then they take the picture home and use it to study from – at least that’s what they tell me. I hope this is a help. I can talk and write on the board much faster than students can write. It seems to me that sometimes note taking can be a distraction. That is, kids are so busy writing down everything that they are not following the flow of ideas.  So, if listening and then taking a picture helps them learn better, I’m all for it.

I also post assignments, worksheets, and so forth online. Students download them to their iPads and always have them handy.

In a previous post I discussed how I use an app called Socrative in my classes.

Please share your experiences with in-class iPad use. Use the “leave a comment” link below.

Arbitrary Ranges

In my last post I discussed the idea that the ranges of the inverse trigonometric functions are chosen somewhat arbitrarily. For good reasons, the ranges always include the first quadrant and the adjoining quadrant (II or IV) where the function is negative. If possible, the range is also chosen to be continuous. Still the choices are arbitrary.

I discussed the range of the inverse tangent function in relation to the value of the improper integral \int_{0}^{\infty }{\frac{1}{1+{{x}^{2}}}dx}. I noted that if we used some other continuous range for the inverse tangent that the result of this or any other definite integral of this function gives the same value. Thus a range for the inverse tangent of \left( -\tfrac{\pi }{2},\tfrac{\pi }{2} \right),\left( \tfrac{\pi }{2},\tfrac{3\pi }{2} \right),\left( \tfrac{3\pi }{2},\tfrac{5\pi }{2} \right), etc. will give the same result.

For antiderivatives involving the inverse tangent or inverse cotangent this is true, but what about the other inverse trigonometric functions?

When evaluating the difference between two values as one does when evaluating a definite integral any range which results in a graph “parallel” to the graph over the commonly accepted range gives the same value.

However, for an integral requiring the inverse sine, if we use the range \left[ \tfrac{\pi }{2},\tfrac{3\pi }{2} \right],

\displaystyle \int_{0}^{1/2}{\frac{1}{\sqrt{1-{{x}^{2}}}}dx}=\left. {{\sin }^{-1}}\left( x \right) \right|_{0}^{1/2}

={{\sin }^{-1}}\left( \tfrac{1}{2} \right)-{{\sin }^{-1}}\left( 0 \right)=\tfrac{5\pi }{6}-\pi =-\tfrac{\pi }{6}

Indicating that a region above the x-axis has a negative area!

So \left[ \tfrac{\pi }{2},\tfrac{3\pi }{2} \right] is not a good choice. We could use other ranges for the inverse sine function but they would have to be such that they result in inverse sine graphs “parallel” to the usual graph. So we could use \left( \tfrac{3\pi }{2},\tfrac{5\pi }{2} \right) or \left( \tfrac{7\pi }{2},\tfrac{9\pi }{2} \right), but not \left( \tfrac{5\pi }{2},\tfrac{7\pi }{2} \right).

The same problem arises with the inverse cosine, the inverse secant, and the inverse cosecant.

It is best to stick with the commonly accepted ranges. Still, going off on tangents often helps sharpen a student’s understanding.


Improper Integrals and Proper Areas

A few years ago, on the old AP Calculus discussion group a teacher asked a question about this improper integral:

\displaystyle \int_{0}^{\infty }{\frac{1}{1+{{x}^{2}}}dx}=\underset{b\to \infty }{\mathop{\lim }}\,\int_{0}^{b}{\frac{1}{1+{{x}^{2}}}dx}

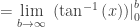
=\underset{b\to \infty }{\mathop{\lim }}\,\left. \left( {{\tan }^{-1}}\left( x \right) \right) \right|_{0}^{b}

=\underset{b\to \infty }{\mathop{\lim }}\,\left( {{\tan }^{-1}}\left( b \right)-{{\tan }^{-1}}\left( 0 \right) \right)=\frac{\pi }{2}  

His (quite perceptive) student pointed out that the range of the inverse tangent function is arbitrarily restricted to the open interval \left( -\tfrac{\pi }{2},\tfrac{\pi }{2} \right). The student asked if some other range would affect the answer to this problem. The short answer is no, the result is the same. For example, if range were restricted to say \left( \tfrac{5\pi }{2},\tfrac{7\pi }{2} \right), then in the computation above:

\underset{b\to \infty }{\mathop{\lim }}\,\left( {{\tan }^{-1}}\left( b \right)-{{\tan }^{-1}}\left( 0 \right) \right)=\tfrac{7\pi }{2}-3\pi =\tfrac{\pi }{2}

The value is the same. While that is pretty straightforward, there are other things going on here which may be enlightening. The original indefinite integral represents the area in the first quadrant between the graph of y=\frac{1}{1+{{x}^{2}}} and the x-axis. Let’s consider the function that gives the area between the y-axis and the vertical line at various values of x.
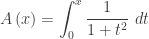
A \displaystyle\left( x \right)=\int_{0}^{x}{\frac{1}{1+{{t}^{2}}}}\ dt

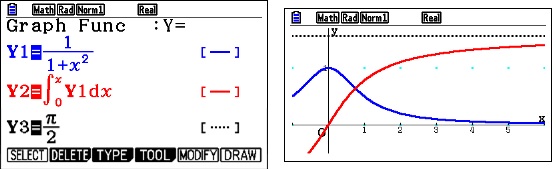
Pretending for the moment that we don’t know the antiderivative, we can use a calculator to graph the area function. Improper integralOf course, we recognize this as the inverse tangent function, but what is more interesting is that whatever this function is, it seems to have a horizontal asymptote at y=\tfrac{\pi }{2}. The area is approaching a finite limit as x increases without bound.  The unbounded region has a finite area. The connection with improper integrals is obvious.

\displaystyle \underset{b\to \infty }{\mathop{\lim }}\,A\left( b \right)=\underset{b\to \infty }{\mathop{\lim }}\,\int_{0}^{b}{\frac{1}{1+{{x}^{2}}}dx=}\int_{0}^{\infty }{\frac{1}{1+{{x}^{2}}}dx}

Also, the improper integral is defined as the limit of the area function. This may give some insight as to why improper integrals are defined as they are.

Socrative

As you may know I have un-retired this year and gone back to high school teaching; I’m filling in for a friend who is on sabbatical. It turns out that this takes a lot of time and so I’ve been writing very little and perhaps neglecting my blog. Today I would like to share a website that I’ve been using this year with both my BC calculus students and my eighth grade Algebra 1 students. It is called Socrative; the URL is www.socrative.com.

The website is similar to a “clicker.” It can be used with a computer, a smart phone, an iPad or other tablet – anything that can connect to the internet. The first time teachers join they get a “room number” that remains theirs from then on. The teacher, working on the teacher side of the site, then prepares quizzes or tests. When the students sign in, they need enter only the teacher’s “room number” and they are ready to go. The teacher starts the quiz, and the students see the questions and answer them on their device. The results are instantly shown on the teacher’s screen.

The questions can be multiple-choice with two (for true-false question) to five choices. Questions may also be open-ended allowing students to enter longer answers. The teacher can supply the correct answer and / or an explanation. Instead of prepared work there is also the option of single-question activities. This is what I use most often. I present the question on the board and the students answer one question at a time on their device.

The results appear on the teacher’s screen which I project for the class. Multiple-choice results are displayed as a bar graph for each choice. Short answers display whatever the student wrote. This allows students to see other forms of the correct answers and spot common mistakes. (Be aware that some students may enter an answer of 2/3 as a forty-place decimal, but that’s not really so bad.)

You have the option to allow the students’ names to appear with their answer. I don’t do that too often. When I do I explain that making fun of someone who made a mistake is a form of bullying and rather they should help whoever got it wrong instead of making fun of them.

Projecting the answers allows the teacher to have immediate feedback – formative assessment. If there are a lot of wrong answers, then you know you have to work more on that concept; if the answers are all or almost all correct you can go on to the next idea.

I used it quite well with eighth grade students in Algebra 1 with all the evaluating of expressions, simplifying, and equation solving in that course and next semester for factoring. I used it recently with my BC calculus classes when we were learning how to write justification for free-response questions. Having a variety of correct and almost correct justifications made for a good discussion and a good class.

Both seniors and eighth graders like doing this and, especially the eighth graders ask to do it daily (which I don’t do).

One of the features I like is that there is a running count of how many students are signed and also how many have answered each question. It helps the teacher know everyone is involved. No one can be daydreaming, doing something else, or playing games on their iPad.

A report with each student’s name and answers can be downloaded at the end of the activity as an e-mail or spreadsheet.

Images, including math symbols, can be included in questions as .gif, .jpg or .png flies, but they are pixellated and appear after the question text (i.e. not as inline equations) and there is no way for students to draw graphs. The website does not work well using Chrome on my PC but is fine in Firefox and Internet Explorer. It works on iPad browsers such as Chrome and Safari. There are also free apps available for smart phones, iPads and tablets.

Mean Numbers

Here is a problem for you and your students. The numbers are mean until you get to the end when they all become very nice and well-behaved.  

You could give this to your students individually or as a group exploration. Give each person or group a different function and/or different intervals. Choose a function that has several (3 – 5) turning points in the interval. The function should be differentiable on the open interval and continuous on the closed interval.

It is intended that the work be done on a graphing calculator; you will need to carry 6 or 7 decimal places in their work.

Here is a typical problem. A link to the solution is given at the end.

Consider the function f\left( x \right)=\sin \left( x \right) on the closed interval [1, 12].

  1. Write an equation of a line, y\left( x \right),  between the endpoints of the function. Give the decimal value of its slope and give a graph of the function and the line.
  2. Write the equation of a function h\left( x \right) that gives the vertical distance between f\left( x \right) and y\left( x \right). Since f may be both above and below y this function may have positive and negative values.
  3. Graph h and find its critical values. What are these places with respect to the graph of h?
  4. Calculate the derivative of f at the critical values of h.
  5. Interpret your result graphically.

Click here for the solution.