Tangents and Slopes

Using the function to learn about its derivative. 
In this post we will look at a way of helping students discover the numerical and graphical properties of the derivative and how they can be determined from the graph of the function. These ideas can be used very early, when you are first relating the function and its derivative. (In my next post we will look at the problem the other way around – using the derivative to find out about the function.)
Click on the graph below. This will take you to a graph I posted on the Desmos website (Desmos.com). This is a free and really easy to use grapher, which you and your students can use. If you sign up for your own account, you can make and save graphs for your class or use some of those that are built-in (click on the three horizontal bars at the upper left of the screen). Your students may do this as well. There are also Desmos apps for smart phones and tablets.

When you click on the graph a file called “function => derivative” should open. This is what you should see:
On the left is a list of equations. Those with a colored circle to its left are turned on; click the circle to toggle the graphs on and off. Here’s what they do:

  • f(x) is the equation of the function we will start with. Later you may change this to whatever function you are investigating. You will not have to change any of the others when you change the function. This one should be turned on.
  • g(x) is the derivative of f(x). Leave this turned off.
  • h(x) is a special function. The expression at the end, \frac{\sqrt{a-x}}{\sqrt{a-x}}, is what makes the slider work. This is a syntax trick and not part of the derivative. If x is to the right of a (i.e. x < a) the expression is equal to one and the derivative will graph. If x is to the right of a, (i.e. a < x) then the expression is undefined, and nothing will graph. Initially, turned off.
  • k(x) is the graph of a segment tangent to f at x = a. Click on the equation if you want to see how the segment is drawn by restricting the domain of x. Initially, turned on.
  • The next equation, x = a, is the equation of the dashed vertical line. This is included so that, later, we can see precisely how points on the graph are located above one another. Initially, turned off.
  • (a, f(a)) is the point of tangency. Initially, turned on.
  • The last box is the slider for the variable a. Its domain is shown at the ends. This may be changed by clicking on one end or clicking on the “gear” icon at the top of the list.

The icons at the top right of the graph let you zoom in and out or set the viewing window. You may click on the wrench icon and make other adjustments. “Projector Mode” makes the graph thicker and may help students see better when you project the graph.
Okay, you are now Desmos experts! Really, it’s that easy. The “?” at the top right has a few more instructions and you can download the user’s guide, a brief 13 pages.


Investigating the derivative
Do this before proving all the associated theorems. Let the class discover the relations between the graph of the function and its derivative. Prove them, or explain why they are so, later. You may want to spread all this over several days, perhaps dealing with where the function is increasing or decreasing and extreme values the first day and working with concavity the second.
1. Begin with just f(x), k(x), and the point (a, f(a)) turned on (click the circle to the left of the equation to toggle graphs on and off). Use the slider to move the tangent segment along the graph.
Draw the class’s attention to important things but let them formulate the observations in words. Ask your class a series of questions about what they see. Things like:

  • When the function is increasing, is the slope of the tangent segment positive or negative? When the function is decreasing, is the slope of the tangent segment positive or negative? Why?
  • What happens with the derivative when the function changes from increasing to decreasing or vice versa?
  • Notice that sometimes the tangent segment lies above the function and sometimes below. What does the function look like when the tangent is above (below)?
  • In the box for the slider delete the number and type a = 0; this moves the slider to the origin. Can you see what its slope is here? You can type in other numbers such as pi/6, or pi/2 and read the slope there. (If the slider disappears when you do this, type in a = 0 and it will come back.)
  • If you can project on a white board or are using a Smartboard, mark the points (a, slope at a) and see if you can graph the derivative.

2. Next turn on h(x) and x = a. Move the slider.

  • What are you seeing? As you move the slider the dashed vertical line moves to show you where you are. The graph of the derivative is drawn to the left of the dashed line.
  • Once again question the class about what they observe. Notice such things as on intervals where the function increases, the derivative is greater than or equal to zero, etc. Review all the things you discovered in part 1. Remember often students don’t associate things such as “the derivative is negative” with the “graph of the derivative lies below the x-axis.“
  • How does the concavity relate to the graph of the derivative?

3. Now change the starting function to something else.

  • First, just add a constant to f(x). If you really want to get fancy type f(x) = sin(x) + b. A slider for b will appear. Discuss why this transformation does not change the graph of the derivative one bit.
  • Some good examples are f(x) = cos(x), f(x) = x+2sin(x), a third- or fourth-degree polynomial (find a good example in your textbook and see below). Repeat all of steps 1 and 2 above.

Give the students a new function and see if they can sketch the (approximate) graph of the derivative themselves.


For further exploration click the graph below. This is similar to the first one; however, the function is a fourth degree polynomial with variable coefficients. Use the various sliders at the bottom to adjust the graph to an interesting shape. Make p = 0 to graph a cubic and make both p and q zero to graph a parabola. (This might make a good lesson in an advanced math or Algebra 2 class.)

A disclaimer: A function and its derivative should not be graphed on the same axes, because the two have different units. Nevertheless, I have done it here, and it is commonly done everywhere to compare the graphs of a function and its derivatives so that the important features of the two can be lined up and compared easily.

.


Good Question 3 1995 BC 5

A word before we look at one of my favorite AP exam questions, I put some of my presentations in a new page. Look under the “Resources” tab above, and you will see a new page named “Presentations.” There are PowerPoint slides and the accompanying handouts from some talks I’ve given in the last few years. I also use them in my workshops and AP Summer Institutes.

This continue a discussion of some of my favorite question and how to use them in class.You can find the others by entering “Good Question” in the search box on the right.

Today we look at one of my favorite AP exam questions. This one is from the 1995 BC exam; the question is also suitable for AB students. Even though it is 20 years old, it is still a good question.  1995 was the first year that graphing calculators were required on the AP Calculus exams.They were allowed, but not required for all 6 questions.

1995 BC 5

The question showed the three figures below and identified figure 1 as the graph of f\left( x \right)={{x}^{2}}  and figure 2 as the graph of g\left( x \right)=\cos \left( x \right)
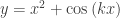
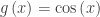
.  The question then allowed as how one might think of the graph is figure 3 as the graph of h\left( x \right)={{x}^{2}}+\cos \left( x \right), the sum of these two functions. Not that unreasonable an assumption, but apparently not correct.

1995 BC 5

Part a: The students first were asked to sketch the graph of h\left( x \right) 
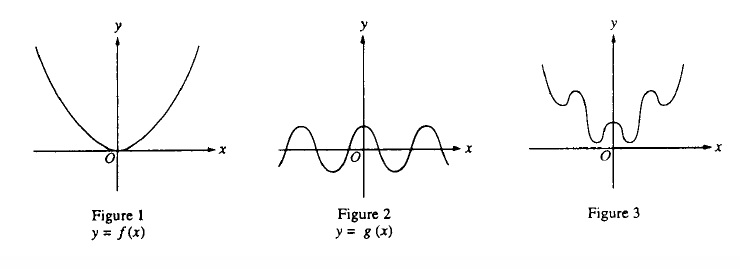
in a window with [–6, 6] x [–6, 40] (given this way). A box with axes was printed in the answer booklet.  This was a calculator required question and the result on a graphing calculator looks like this:


1995 BC 5

y={{x}^{2}}+\cos \left( x \right).
The window is [-6,6] x [-6, 40]

Students were expected to copy this onto the answer page. Note that the graph exits the screen below the top corners and it does not go through the origin. Both these features had to be obvious on the student’s paper to earn credit.

Part b: The second part of the question instructed students to use the second derivative of h\left( x \right) to explain why the graph does not look like figure 3.

\displaystyle \frac{dy}{dx}=2x-\sin \left( x \right)

\displaystyle \frac{{{d}^{2}}y}{d{{x}^{2}}}=2-\cos \left( x \right)

Students then had to observe that the second derivative was always positive (actually it is always greater than or equal to 1) and therefore the graph is concave up everywhere. Therefore, it cannot look like figure 3.

Part c: The last part of the question required students to prove (yes, “prove”) that the graph of y={{x}^{2}}+\cos \left( kx \right) either had no points of inflection or infinitely many points of inflection, depending on the value of the constant k.
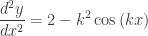
Successful student first calculated the second derivative:

\displaystyle \frac{dy}{dx}=2x-k\sin \left( kx \right)

\displaystyle \frac{{{d}^{2}}y}{d{{x}^{2}}}=2-{{k}^{2}}\cos \left( kx \right)

Then considering the sign of the second derivative, if {{k}^{2}}\le 2, \frac{{{d}^{2}}y}{d{{x}^{2}}}\ge 0 and there are no inflection points (the graph is always concave up). But, if {{k}^{2}}>2, then since y” is periodic and changes sign, it does so infinitely many times and there are then infinitely many inflection points. See the figure below.

k = 8

k = 8


Using this question as a class exercise

Notice how the question leads the student in the right direction. If they go along with the problem they are going in the right direction. In class, I would be inclined to make them work for it.

  1. First, I would ask the class if figure 3 is the correct graph of h\left( x \right)={{x}^{2}}+\cos \left( x \right). I would let them, individually, in groups, or as a class suggest and defend an answer. I would not even suggest, but certainly not mind, if they used a graphing calculator.
  2. Once they determined the correct answer, I would ask them to justify (or prove) their conjecture. Again, no hints; let the class struggle until they got it. I may give them a hint along the lines of what does figure 3 have or do that the correct graph does not. (Answer: figure 3 changes concavity). Sooner or later someone should decide to check out the second derivative.
  3. Then I’d ask what could be the equation for a graph that does look like figure 3. You could give hints along the line of changing the coefficients of the terms of the second derivative. There are several ways to do this and all are worth considering.
    1. Changing the coefficient of the x2 term (to a proper fraction, say, 0.02) will do the trick. If that’s what they come up with fine – it’s correct.
    2. If you want to be picky, this causes the graph to go negative and figure 3 does not do that, but I ‘d let that go and ask if changing the coefficient of the cosine term in the second derivative can be done and if so how do you do that.
    3. This may be done by simply putting a number in front of the cosine term of the original function, say h\left( x \right)={{x}^{2}}+6\cos \left( x \right)
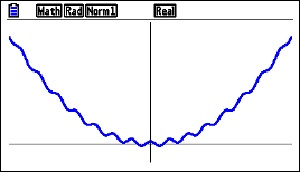
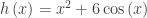
, but the results really do not look like figure 3,
    4. If necessary, give them the hint y={{x}^{2}}+\cos \left( kx \right)

1995 was the first year graphing calculators were required on the AP Calculus exams. They were allowed for all questions, but most questions had no place to use them. The parametric equation question on the same test, 1995 BC 1, was also a good question that made use of the graphing capability of calculators to investigate the relative motion of two particles in the plane.   The AB Exam in 1995 only required students to copy one graph from their calculator.

Both BC questions were generally well received at the reading. I know I liked them. I was looking forward to more of the same in coming years.

I was disappointed.

There was an attempt the following year (1997 AB4/BC4), but since then nothing investigating families of functions (i.e.  like these with a parameter that affects the shape of the graph) or anything similar has appeared on the exams. I can understand not wanting to award a lot of points for just copying the graph from your calculator onto the paper, but in a case like this where the graph leads to a rich investigation of a counterintuitive situation I could get over my reluctance.

But that’s just me.

Flipping (Part 2)

Today our guest blogger continues his discussion of Flipping begun last week. Bobby Barber is a mathematics teacher at Millville Senior High School in Millville, NJ. In these two posts he shares his experiences with Flipping his AP Calculus class. He asks that you reach out with questions, suggestions and stories of your own. Use the comment button at the end of the post. Bobby may be contacted directly at robert.barber.jr@millvillenj.gov 

Tips for Flipping…Things I’ve Learned Over the Past 9 Semesters

Start out slow. Flip one lesson, one chapter, one unit, one class…just flip SOMETHING. I have talked to a lot of teachers that say they need to try flipping, but they keep putting it off because they don’t know how to get started. Flipping is going to be outside of your comfort zone when you start, but you can’t be afraid to fail…it will get easier, and you’ll figure out what works for you and your students.

Don’t make the mistake of thinking the video is the most important thing…it’s not. The most important thing is having a plan for how you will run class now that the lecture portion has been removed (or at least drastically reduced). There is plenty of information out there to get ideas and I suggest you look for some, but the best ideas for your kids will be modifications of other people’s ideas that you come up with after giving it a try.

Videos are still important! There are a few things to consider when choosing the video(s) your students will watch:

1. How long will the video be? There are a couple of ideas out there on this concept. Some people suggest no more than a minute per grade level. Some say the same thing, but per age of the kids. Others say never over 10 minutes. I’m not a big fan of rules, but I would suggest the following guidelines: about 5 minutes max for elementary, 5 – 10 minutes for middle school, and under 20 minutes for high school students. I have found 10 – 15 minutes best for my high school kids, but I do have a couple of videos over 20 minutes. I talk to my class when I assign those videos and let them know that I need them to be ready for a long video and plan accordingly.

2. How do you know if your students watched the videos? Again, I have heard of many different ways to assess this and have tried several myself. Some people just watch their students doing the problems the next day in class and feel it is pretty obvious who watched the video and who did not. Others require students to show their notes at the beginning of class. I used to give a quick quiz to see who watched. I would ask a few basic questions and a couple that they couldn’t know without watching, like “what color was my shirt?”

An effective and useful way for many others and me is through an online class management system. There are many of them out there, but the best by far is EDpuzzle (www.edpuzzle.com). I have tried others and none compare. It allows you to embed questions in any video, yours or ones you found online. You can assign due dates for the videos and see how many times the students watched the whole video or specific parts of the video. I have been using EDpuzzle for a year and it has made my flipped classes twice as effective.

If you would like to see an example of a video on EDpuzzle, create a free account at www.edpuzzle.com. After signing in click, on EDpuzzle on the left and then search for “Bobby Barber” under videos. This will bring up all of my videos. The ones with me in front of the screen (in the middle of the videos that come up) are the ones I created.

3. How do you make sure every student has access to the videos? This is usually the cause of the most concern among potential flippers. Just because you teach in a low-income district, doesn’t mean you can’t find a way to get your videos to your students. A good number of your kids are going to have internet access. This means you can post your videos on EDpuzzle, YouTube, your teacher website, or some other medium. If students don’t have internet at home, they often have smart phones with Wi-Fi access. If your school has Wi-Fi, have the students download the videos to their phones in class through YouTube, iTunesU, or some other medium and watch the videos at home. You can also put your videos on a USB or DVD for students to take home. I have a couple of students every year that either go to the school library or come to my classroom and use my computer either before or after school or during their lunch or a study hall.

Even if students don’t have reliable internet, many have computers and more have DVD players or video game systems which allow them to play USB/DVDs. Finally, if none of these options work for one or more of your students, let them watch the video in class. More than likely, this will be a very small percent of your class. If you let them watch the video on your computer as a small group or have a laptop cart or other option available, you can differentiate instruction   to meet the needs of all of your students. Let the ones with the ability to watch the videos at home get started on problems or activities and have the others watch the video and finish their problems at home. You will have to cater this to your class/students, but I believe it will be worth it in the end.

4. What happens when students don’t watch the videos? I believe this is another problem that has different solutions depending on your situation. If a student is capable of watching the video and chooses not to, there must be a consequence. I know some elementary teachers that will make the kids watch the video in class and do worksheets instead of doing the more engaging activities the rest of the class does that day. I also make my students watch the video in class if they didn’t do the homework, and have them jump into whatever everyone else is doing when they are done. They still get a zero for their homework grade, but I like to minimize missed opportunities. Some teachers start class with a group share-out so students that didn’t get to watch the videos get to at least hear a summary from the ones who did in a small group setting.

5. Using Videos vs. Making Your Own: I started out using videos that were already made. There is so much to figure out when getting started flipping that spending the incredible amount of time to create quality videos may not be worth it at first. If you are using a video, you must watch and know every detail of it. You must also know exactly what you want your kids to get out of the next day in class and prepare a lesson that combines the information in the video with your own presentation to accomplish that. Spend your time on lesson planning early.

That being said, I have a lot more success and buy-in when students are watching my own videos. For them and many of their parents, it still feels like I’m teaching the class. It took me two years to create my videos, partially because I wasn’t sure flipping was going to work and partially because it takes a long time to create a good video teaching calculus or any other type of math. I create my videos exactly like I would teach a class. There is a camera in front of me with my presentation projected on the board. Many people I know refuse to be in front of a camera and do a screen cast. If you are uncomfortable putting your face/body on camera, I have two bits of advice. 1: get over it…you’re in front of your kids every day. Who cares if it is in the classroom or on their computer? 2: if you absolutely can’t get over it, make your video as interesting as possible. Voicing over a PowerPoint isn’t going to grasp the kids’ attention. Some people put pictures of their students doing problems. Others insert funny or interesting videos throughout the presentation. Whatever you do, ask yourself “Would I be able to watch and learn from this video?” before you expect your students to do it.

6. Classroom organization: I have put a lot of thought and a pretty good amount of research into how I set up my classroom. The most important aspect of my classroom is the whiteboard on every wall. The picture shows my students working at the whiteboards during class one day.Notice that all the students are involved.

Barber 2

I have also found that the kids are less worried about making mistakes on the whiteboards because they are able to erase mistakes and wrong answers quickly. With all the research I read on activity vs. learning, I don’t know what I would do without being able to have all my students actively doing their work at the boards every day.

I have always enjoyed teaching, but since I started flipping, my love of our profession has grown dramatically. I have been able to cover more material than just what is in our curriculum and dig deeper into all of the math that I teach. My students have been more successful on standardized tests and their confidence and interest in math has grown dramatically, in my opinion. If flipping is something you think your may be interested in trying, then figure out a way to give it a try. If you do, remember that there are no rules for flipping. As you look into what others are doing, find a variation that you think will work for you and adapt it to fit you and your students as you go.

If you are looking for help, suggestions, or advice on flipping your class, there are a ton of people who flip and I bet most of them would be happy to help. I certainly would be. For those of you on Twitter, the hash tag #flipclass is great and there is even a chat on Monday nights.

Thanks for reading this and good luck,

Bobby Barber

Flipping

Today I am happy to welcome a guest blogger. Bobby Barber is a mathematics teacher at Millville Senior High School in Millville, NJ. In this and the next post he shares his experiences with Flipping his AP Calculus class. He asks that you reach out with questions, suggestions, and stories of your own. Use the comment button at the end of the post. Bobby may be contacted directly at robert.barber.jr@millvillenj.gov 

What is a “Flipped” Class?

A flipped class is one where the traditional lecture and note taking is done outside of class time; usually by having students watch a video lesson. The students can re-watch all or parts of the video if they don’t understand something without worrying about interrupting the teacher or having the rest of the class know they don’t get something. Students then do practice problems that would previously be done for homework in class with peer and teacher support. Other projects, explorations, and activities are also done in class. Hence, the traditional in-class and at-home routines have been “flipped.”

Why I Flipped:

I started teaching AP Calculus in 2010 after 8 years of teaching regular level math classes. During my second year teaching, our school went to an integrated math curriculum (IMP) for our regular math classes.Bobby Barber The classes were discovery-based and very interactive and I loved teaching them. (Why we never used this for our advanced classes, I will never know.) I was one of two teachers that taught primarily IMP classes and we both had a lot of success with our students, both on local and state assessments. When our AP Calculus teacher changed positions, I was asked to teach the class.

I teach at the same high school that I attended, and my AP Calculus teacher was very popular and had a reputation as being a great teacher. I got a five on the AP exam when I was in his class, so I figured I would model my class after what he did: homework questions, lecture, examples, practice, homework, repeat.

Within a couple of weeks, I realized some things. First, I hated lecturing. Second, I wasn’t getting to know the kids at all, being that I was in the front of the room the whole time. My biggest problem, though, was that I was spending about half of each class going over homework problems. Almost every student was doing the homework and asking legitimate questions about it, but most of the questions had simple solutions. They messed up a sign, or a distribution, or some other arithmetic/algebraic concept that caused them to get the calculus question wrong. This gave them a negative attitude towards calculus, which they didn’t deserve.  I thought that if they could get help along the way to avoid these types of mistakes, they would enjoy and appreciate calculus more.

I decided to let them watch videos of the concepts at home and do problems in class.  During the summer that I thought of this, I found a lot of information on people already doing this and calling it a “flipped” classroom. I decided that I was going to try it during the next school year.

How I Started Flipping

Even though I was hell-bent on trying the flipped class out, I wasn’t sure how to do it. I teach in a Title 1 district where many students don’t have access to computers/internet at home. (This has improved drastically, but wasn’t great when I started). Also, no one had ever tried this at my school and I wasn’t sure what kind of support I would receive from the administration. I had other ideas for improving my classes, especially AP Calculus, so I decided to try them first. I had some success with these changes, but I still wasn’t convinced I was getting the most out of my time with the students, so I decided to give flipping a try.

I started by watching videos in class with the students. I would project the video and have the students take notes, then do a mini lesson afterwards highlighting and adding what I thought was necessary. I continued this for a chapter. The students seemed to like it, so I took it a step further and assigned videos for homework for the next chapter. I would post the videos on my website and e-mail the links to the students for them to watch at home. Students who didn’t have access would watch on my computer at the beginning of class each day. We then did problem sets in class and students helped each other and used me if they couldn’t figure something out themselves.

I was extremely happy with the results (just intuitive, but I knew I was on to something), so I went to my principal and guidance supervisor to request that I run my class like this permanently. Neither of them had heard of flipping, but once I explained what I wanted to do, they were both all for it. From some of the stories I have heard from colleagues in other schools and on social media, administrators can really ruin a school. I am in the exact opposite situation. My principal lets us try pretty much anything we think will help the students. Once I had her blessing, I ran with it and never looked back.

Benefits of flipping

I have seen a marked improvement in AP exam scores since I started flipping. I think there are several reasons for this improvement. Since flipping my class, I am able to cover way more material in class. On top of covering more material, I am able to cover that material at a deeper level. I have time for explorations, discovery, and quality student discussions in class, where I never had much time for that before because I was always rushing to get through the curriculum and answer students’ homework questions.

The one benefit that a flipped classroom gives me that I don’t know how else to get is the interaction with my students. I get to circulate and talk to every one of my students every day while they are doing math. I get to talk to them about their thought process with the math they are doing and about other things going on in their lives. I really get to know my students over the course of a semester and that helps me help them. I don’t know how else you can develop relationships with 50-75 kids seeing them for 85 minutes a day for 90 days (or whatever schedule your high school is on). These relationships are the biggest benefit of a flipped classroom. The students and I get to know and care about each other, which gives us extra motivation to work hard for each other.

Continued in the next post scheduled for Wednesday July 1, 2015

Graphing Calculators

I was asked to pass the following information along to you. I decided to do so because you may want to know about one of the newest CAS calculator models and because their follow-up offer for attending the summer institute is so generous. HP_Prime_w_Wireless_Module_250pxIf your school and students need help getting calculators and/or you want to keep up with the latest trends, you may be interested in looking into this.

The calculator is the new Hewlett-Packard HP Prime. It is a CAS calculator with really good graphing features. HP is offering the HP Prime AP Summer Institute Program, a 3-Day Institute this summer in either Statistics or Calculus with expert teacher trainers to introduce their new Mathematics Solution, the HP Prime Wireless Classroom. Following the Summer Institute, teachers who attended will receive a donated HP Prime Wireless Classroom Kit for their school with 30 HP Prime Graphing Calculators and the HP Prime Wireless Kit (a $5,000 value!).

The institute is an opportunity to improve your knowledge of teaching mathematics with a technology that makes learning intuitive for students and receive the technology to keep for classroom use.

For more information click the link https://h30602.www3.hp.com/assets/hpmath/web1.html


Some Graphing Calculator History

Graphing calculators first came on the market around 1989.  In the early 1990s after it was announced that graphing calculators would be required on the AP Calculus exams starting in 1995, there were a series of workshops following the AP calculus reading, then at Clemson University. They were called the Technology Intensive Calculus for Advanced Placement conference or TICAP. Half the readers were invited to stay after the reading for the conference. The next year the other half were invited, and others the third year. Casio, Texas Instruments, Hewlett-Packard, and Sharpe all contributed and provided their calculators to the participants.

The Texas Instrument calculators (then the TI-81 and TI-82) emerged the most popular and have since been the most popular in the United States. TI to their credit makes a good product and provided, and still provides, lots of help for teachers in the form of print material, programs for the calculators, workshops, and meetings. They have developed ways to connect the classroom’s calculators to the teacher’s computer. Other manufacturers have done the same, but not on TI’s scale.

TI has made improvements in their calculators and other manufacturers have made newer and improved machines as well. While similar in functionality, I think the Casio PRIZM to be a bit better than the latest TI-84 model; it is also a bit less expensive. TI’s ‘Nspire line is an excellent CAS machine. Casio also has several CAS calculators and HP has now come out with the new HP Prime model (mentioned above). There are others. TI has a whopping 92% market share with Casio far behind at 7%. While their machines are excellent, Casio and HP are playing catch-up and have a long way to go.

If you are just starting out or have limited funds for your class, you might consider a different brand. I often think the main problem is that the buttons are all in the wrong place! That is, the keyboards are different than the TIs we all learned on. They are different for you, but students who have never learned the old way will have no trouble with the keyboards. You won’t either – just sit down with the guidebook for a couple of hours and you’ll become an expert (or let the kids help you!). You can also use the manufacturer’s online instructions or go to a summer institute such as HP’s mentioned above.

Some Graphing Calculator Opinion

Now comes the real heresy. Graphing calculators don’t graph all that well. Their screens are small and often crowded. Tablets such as an iPad, or computers do a much better job. (For example, TI-Nspire’s operating system is available as an iPad app that is easy to use and much easier to see (okay maybe I’m getting old and my eyes are not what they once were). Still the many other graphing and mathematics related apps available are fabulous. Graphing, statistics and geometry apps abound and will only increase in number and functionality. This is the future.

The reason graphing calculators are still here is because the Educational Testing Service, for good reason, will not let students use any device with a QWERTY keyboard on their exams including the Advanced Placement exams. The primary reason is that they are afraid that students will copy the secure questions using the QWERTY keyboards on iPads and computers. For some reason, students apparently cannot figure out how to do this with the alphabetic keyboards on graphing calculators. (Or as Dan Kennedy once quipped, there is nothing wrong with the old method of writing them on your cuff.) Other more important reasons tablets are not allowed include being able to photograph the questions, get information and help through the internet during the exams, or communicating with others in or out of class with tweets and instant messages.

These are real problems that need to be considered, but I cannot believe a work-around is not possible. It must be possible to make an app that will allow only the use of approved apps during exams. After all they have done that for graphing calculators.

If technology helps students learn mathematics – and I believe it does – then students should have the best available technology.

End of sermon. Take a moment or more to consider the new and improved calculators.

Update – iPad’s “Educational Standardized Testing” Option

I wrote the paragraphs above a few days ago. This morning the new operating system 8.1.3 for iPad became available. They have a new feature for “educational standardized testing.” You can turn it on under Settings > Accessibility > Guided Access. Once turned on you open any app, triple-click the home button, and the controls for that one app appear on the screen.

The individual settings are slightly different for each app. You may turn off the keyboard, turn off the touch screen, or disable the dictionary. On apps with their own buttons you can turn off any or all of the buttons by circling them. A time limit may also be set.

It appears for now that each iPad must have these features adjusted individually. Unfortunately, to change or turn the restricted features on again all a student needs is his or her passcode or fingerprint. In addition, there should be a way to turn off all the other apps where students may quite legitimately have notes or homework saved. (Most of my students last year in one-to-one classrooms took most of their notes and did their homework on their iPads.)

This is a good start, but it has a long way to go before it can be used in group settings. Stay tuned for updates.