
For the last few post, we have been exploring roulettes using the roulette generator (RG) for either Winplot or Geometer’s Sketchpad. These files use the equations


The derivative is given by the equations


Notice that the derivative is also a form of roulette.
To generate various roulettes by changing the values of R and S as explained in the first post in this series.
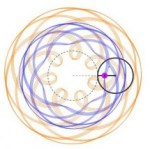
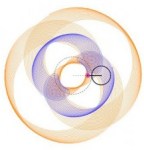
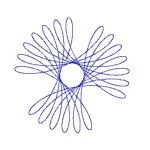
When my friend Audrey Weeks finished making the Sketchpad RG for me she sent these three designs that she made using the generator. Suddenly, we were into art!
-
-
R = 0.713, S = 0.436,
Revolutions = 17
-

-
R = – 0.332, S = +/- 0.3,
Revolutions = 17
-
-
R = 0.506, S = 0.728,
Revolution = 17
The designs may make a nice project for students studying parametric curves and help them learn a little more about the curves and their graphs. Here are some hints about how to use the Winplot RG to make these designs. (Most of the hints will also do for the Sketchpad RG except for changing colors, and generating several curves at once.)
Hint 1: Begin by opening the RG file and saving it with a different name so you can makes the changes and still have the original available. In the new file,
- Open the Inventory (CRTL+I) and delete everything except the one marked “Roulette” and the one marked “Velocity Graph” by selecting each and clicking the “delete” button. This will remove the circles and other lines from the final drawings.
- Then make a duplicate of the two remaining files by selecting them and clicking “dupl.” For the duplicates, click “edit” and change the sign preceding the S. This will let you draw graphs for S and –S at the same time. More on this below.
- Click CTRL+G and turn the axes off.
Hint 2: Number of revolutions: We learned in the first post in this series that from the number R expressed as a reduced fraction 
When using a large value of d the parts of the graph overlap each other and add to the design. So, use a large d to get a “fancier” graph.
If you use n revolutions your graph will have a number of rotational symmetries offset by 
But you also get nice designs by using less than n revolutions. This draws part of the graph and can also make a pleasing design. See the captions to the figures in this post to get an idea of how this works.
Hint #3: Color: You can change the color by selecting the equation in the Inventory list and clicking “edit” and then “color.” The background color can be changed by clicking “Misc” in the top bar and then “Background.”
Hint #4: Dips, loops and cusps: These are controlled by the S slider. If 


So, let’s try one. First graph: I chose R = –0.321 and S = 0.440. Since 321/1000 does not reduce, there will be 1000 loops in 321 revolutions. But I graphed only about 6.5 revolutions (A = 40.212). Second Graph: includes the derivative of the first made by using the velocity equation in the Inventory.
-
-
R = –0.321 and S = 0.440,
Revolutions = 6.5
-

-
R = –0.321 and S = 0.440,
Revolutions = 6.5
These were just a few hints to get you started. In the next post we’ll look at some much more fancy designs. Meanwhile try some of your own and post them as comments. (Please include the R, S, and revolution values you used.).
Preview of the next post Roulettes and Art – 2:

