Foreshadowing the MVT

The Mean Value Theorem (MVT) is proved by writing the equation of a function giving the (directed) length of a segment from the given function to the line between the endpoints as you can see here. Since the function and the line intersect at the endpoints of the interval this function satisfies the hypotheses of Rolle’s theorem and so the MVT follows directly. This means that the derivative of the distance function is zero at the points guaranteed by the MVT. Therefore, these values must also be the location of the local extreme values (maximums and minimums) of the distance function on the open interval. *

Here is an exploration with three similar examples that use this idea to foreshadow the MVT. You, of course, can use your own favorite function. Any differentiable function may be used, in which case a CAS calculator may be helpful. Answers are at the end.

First example:

Consider the function f(x)=x+2\sin (\pi x) defined on the closed interval [–1,3]

  1. Write the equation of the line through the endpoints of the function.
  2. Write an expression for h(x) the vertical distance between f(x) and the line found in part 1.
  3. Find the x-coordinates of the local extreme values of h(x) on the open interval (–1,3).
  4. Find the slope of f(x) at the values found in part 3.
  5. Compare your answer to part 4 with the slope of the line. Is this a coincidence?

Second example: slightly more difficult than the first.

Consider the function f\left( x \right)=1+x+2\cos \left( x \right) defined on the closed interval \left[ {\tfrac{\pi }{2},\tfrac{{9\pi }}{2}} \right]

  1. Write the equation of the line through the endpoints of the function.
  2. Write an expression for h(x) the vertical distance between f(x) and the line found in part 1.
  3. Find the x-coordinates of the local extreme values of h(x) on the open interval \left( {\tfrac{\pi }{2},\tfrac{{9\pi }}{2}} \right)
  4. Find the slope of f(x) at the values found in part 3.
  5. Compare your answer to part 4 with the slope of the line. Is this a coincidence?

Third example: In case you think I cooked the numbers

Consider the function \displaystyle f(x)={{x}^{3}} defined on the closed interval \displaystyle [-4.5]

  1. Write the equation of the line thru the endpoints of the function.
  2. Write an expression for h(x) the vertical distance between f(x) and the line found in part 1.
  3. Find the x-coordinates of the local extreme values of h(x) on the open interval \displaystyle (-4,5)
  4. Find the slope of f(x) at the values found in part 3.
  5. Compare your answer to part 4 with the slope of the line. Is this a coincidence?

Answers

First example:

  1. y = x
  2. \displaystyle h(x)=f(x)-y(x)=\left( {x+2\sin (\pi x)} \right)-\left( x \right)=2\sin (\pi x)
  3. {h}'\left( x \right)=2\pi \cos \left( {\pi x} \right)=0 when x = –1/2, ½, 3/2 and 5/2
  4. \displaystyle {f}'\left( x \right)=1+2\pi \cos \left( {\pi x} \right), the slope = 1 at all four points
  5. They are the same. Not a coincidence.

Second example:

  1. The endpoints are \left( {\tfrac{\pi }{2},1+\tfrac{\pi }{2}} \right) and \left( {\tfrac{{9\pi }}{2},1+\tfrac{{9\pi }}{2}} \right); the line is y=x+1
  2. h\left( x \right)=f\left( x \right)-y\left( x \right)=\left( {1+x+2\cos (x)} \right)-\left( {x+1} \right)=2\cos \left( x \right)
  3. {h}'\left( x \right)-2\sin (x)=0 when x=\pi ,2\pi ,3\pi ,\text{ and }4\pi
  4. {f}'\left( x \right)=1-2\sin \left( x \right), at the points above the slope is 1.
  5. They are the same. Not a coincidence.

Third example:

  1. The endpoints are (-4, -64) and (5, 125), the line is \displaystyle y=125+21(x-5)=21x+20
  2. \displaystyle h(x)={{x}^{3}}-21x-20
  3. \displaystyle {h}'(x)=3{{x}^{2}}-21=0 when \displaystyle x=\sqrt{7},-\sqrt{7}
  4. \displaystyle {f}'\left( {\pm \sqrt{7}} \right)=3{{\left( {\pm \sqrt{7}} \right)}^{2}}=21
  5. They are the same. Not a coincidence.

* It is possible that the derivative is zero and the point is not an extreme value. This is similar to the situation with a point of inflection when the first derivative is zero but does not change sign.


Teaching Concavity

As you’ve probably noticed, different authors use different definitions based on how they plan to present topics later in their texts. So, the same concept seems to have different definitions. A definition in one book is a theorem in another. Students should be aware of this; looking at different definitions and related theorems about the same idea helps their mathematical education.

Here is a thought on exploring how concepts may be defined and learning about concavity are the same time.

Start by drawing the 4 shapes of (non-linear) graphs (See Concepts Related to Graphs and The Shapes of a Graph.

  • Increasing, concave up
  • Increasing concave down
  • Decreasing concave up
  • Decreasing concave down

Look at the sine or cosine graphs which show all four and the tangent graph that shows only two. Look at other functions as well and identify which parts (intervals) exhibit each shape.

Next, challenge the students, in groups, individually, in class, or for homework to find analytic ways to say what concavity is or to identify it from equations. If they need hints suggest they look at derivatives (first and second) and tangent lines. Don’t limit them – explain that there are other ways. They should try to find several ways.

Hopefully, they will come up with some of these. (I have purposely listed these in a rough preliminary form. That’s how math is done – get an idea and then develop and formalize it)

A function is concave up (down) when:

  1. The slope (derivative) is increasing (decreasing)
  2. The second derivative is positive (negative).
  3. The tangent line lies below (above) the graph
  4. All (any, every) segments joining points in the interval lie above (below) the graph.
  5. Others ???

Finally, clean these up. Help the students:

  • State them as “if, then” or “if, and only if” statements giving the hypotheses for each.
  • Consider how one can be used to imply the others – in either direction.
  • Determine which implies the inclusion of endpoints (1 and maybe 3).
  • Discuss which the class thinks would make the best definition, and which should become theorems.
  • Taking whichever definition your book uses, show how the others can be proved.

The point here is the thinking, forming ideas, doing the mathematics; the understanding of concavity will follow.


L’Hospital’s Rule

Another application of the derivative

L’Hospital’s Rule 

Locally Linear L’Hospital’s Demonstration of the proof

L’Hospital Rules the Graph

Good Question An AP Exam question that can be used to delve deeper into L’Hospital’s Rule (2008 AB 6)

Guillaume de l’Hospital
1661 – 1704


Revised from a post of November 7, 2017


There will be two extra posts this week! Check tomorrow for some suggestions on “Teaching Concavity” and on Friday for “Foreshadowing the MVT.”

I made a major update to last Friday’s post On Scaling. It includes a suggestion from a reader of  this blog with a Desmos graph that will calculate the Kennedy scale scores for you.


On Scaling

Why “scaling” is necessary

No teacher can make two tests on the same topics equal in difficulty. No two teachers, even if they collaborate, can make two tests on the same topic equal in difficulty. No two teachers in different schools, districts, or states can make two tests on the same subject equal in difficulty. Even professional testing companies, such as the Educational Testing Service (ETS) that writes the AP exams, cannot write two tests on the same courses of equal difficulty.

Scaling is needed to account for the difference in difficulty. Scaling attempts to make the scores on different forms of a test indicate that a student writing the test has the same amount of knowledge as another student with a similar score.

The ETS does this by pre-testing its items on college students and including several questions from previous years to help judge the difficulty from year to year. They do a great deal of statistics on each item each year. But they do not pretend that this year’s test is the same difficulty as last year’s test. After their computations and consultations with colleges are done, they scale the test. Their goal is to make the score indicate the same amount of knowledge from test to test and year to year.

A teacher cannot do that in his or her class. They don’t have the resources or the time. Yet, there are ways to even out the difficulty of your classroom tests and quizzes. .

Some poor ways to scale

In what follows, P will represent the percentage of the total points available on a test that a student earns, and S will equal the score the student is given for that percentage.

Percentage scaling (S = P): For many years I, and I expect most teachers, simply let S = P. But sometimes the scores were kind of low: the test was too hard, or the students didn’t do well (or maybe the teacher didn’t do well). What to do? Among the usual solutions are (1) give a make-up test, (2) let the students make corrections to earn back some of the points, (3) scale the test by raising all the grades arbitrarily, or (4) make sure the next test is “easy.” I’ve tried all of them.

Doesn’t make too much sense, does it?

Categories: For quite a few years, I listed the percentages from highest to lowest and looked for natural breaks to separate the scores into 90, 80, 70, etc. Intermediate scores were spread between the cut points. If you don’t need a number to put on the report cards, the categories become A, B, C, etc. with perhaps a “+” or a “–“ attached.

Comic Interlude – the “Square Root Scale”
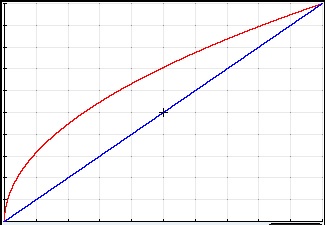
The “square root scale” is S=10\sqrt{P}. So, a 36 is scaled to a 60, an 81 to a 90, and a 70 to an 84. What this accomplishes is to raise everyone score for no reason other than to raise the score. See the graph below. 

The Square Root Curve,S=10\sqrt{P}., in red and the Percentage Curve, S = P, in blue

Compared to the percentage grade, the low scores get raised more than the higher scores. Everyone wins big time, but what does it tell you? I can see no justification for this, except maybe the “complicated” algebra involved fools the students, administrators, and parents into thinking that something really scientific is going on. It’s not.

(Since this is a calculus blog, there is a calculus exercise in the appendix below that analyzes this scheme.)

A Better Choice for Scaling – the Kennedy Scale

While no method is perfect, this method suggested in Assessing True Academic Success by Dan Kennedy [1] is a reasonable and easy one. The entire article is worth reading every year and discusses a lot about assessment, besides just scaling.

He writes of his method, “Mathematically, the effect of scaling is to adjust the mean, a primary goal, and reduce the standard deviation, a secondary effect that helps me keep the entire class engaged.” “[Teachers] can challenge [their] students to do just about anything, then see how far they can go. …[Students] are freed from the burden of getting a certain percent right, so they can concentrate on doing as much as they can as well as they can.”

I used this method for BC Calculus and 8th grade Algebra 1 in the year I came out of retirement and was happy with the results.

Here’s how the method works. First, determine the class mean you desire. Kennedy suggests a class average of 82 for regular classes, 85 for electives, and 90 for advanced. These are based on his school wide empirical (historical) data. You may use your own data or just what you think is reasonable.

Using two data points (class mean, desired mean) and (highest score, 99). (The 99 could be adjusted as you see fit.} Write the equation of the line through these points (P, S) expressing S as a function of P. Use this function to scale the test.

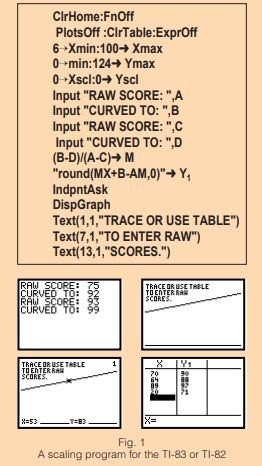
This TI-8x program, from the same article, will easily compute the scores for you. (There is a typo in the fourth line; it should read 0->Ymin:126->Ymax.)


Update Excel Spread Sheet for Kennedy Scale. 

At the suggestion of a reader, here is an Excel spreadsheet for you may download for the Kennedy Curve. Enter the four values at the top left and the scores w ill be calculated.

Updated December 8, 2020


Update Desmos Program for Kennedy Score 

Dan Anderson sent a comment (see below) with a link to a Desmos graph he made that will calculate the Kennedy scale for your tests. You can access the graph here. Once you’ve opened it, save it to your Desmos files.

It works like this: enter the 4 numbers in the left column AverageRawScore, DesiredAverage, MaxRawScore, and DesiredMax as they apply to your test. The scaled scores will appear in the table in the lower left.

To scale your exam, delete everything in the x1 column and enter your scores (in any order, with duplicates). The scaled scores appear in the second column of the table and the pairs are graphed.

The two highlighted points are (AverageRawScore, DesiredAverage) and (MaxRawScore, DesiredMax). These may be dragged to see the effect of changing them.

A final caution: If the AverageRawScore is greater then or equal to the DesiredAverage (or even close), then some scores may be scaled down. You probably want to avoid this (although, it is consistent with the idea).

Updated October 13, 2018

Update October 19, 2020


Remember, by scaling, you are not giving away free points; you are trying to account for the difference in difficulty from one test to the next.


Scaling Different Versions of the Same Test How to adapt the Kennedy method when using different versions of the same test in your class.

Update August 24, 2021

Appendix: An analysis of the Square Root Curve – A Calculus Exercise 

For the function S=10\sqrt{P}.

  1. Determine the percentage score(s), P, which receives the least points using this method. Justify your answer.
  2. Determine the percentage score(s), P, which receives the most points using this method. Justify your answer.
  3. At the value found in 2, what is the slope of the line tangent to the graph of S=10\sqrt{P}?
  4. Compare your answer for 3 to the slope of S = P. Why must this be so? Is it related to the MVT?

Solution

  1. Since the Square Root curve lies above the percentage curve all the values receive some increase except the end points (P = 0 and P = 100) which receive no increase.
  2. Let I = the increase in  the score, then 

I=10\sqrt{P}-P

\displaystyle \frac{{dI}}{{dP}}=\frac{{10}}{{2\sqrt{P}}}-1

\displaystyle \frac{{10}}{{2\sqrt{P}}}-1=0,\text{ when }P=25

This is the maximum since it is the only place where P’ changes from positive to negative. At P = 25 the score is raised by 25 points to a 50.

3. \displaystyle \frac{{dS}}{{dP}}=\frac{{10}}{{2\sqrt{P}}}. At P = 25, dS/dP = 1. The slope of the tangent line is 1.

4. At P = 25 the slope of the tangent line to the square root scale is 1: the tangent is parallel to the percentage graph. The square root scale to the left of P =25 is raising faster then S = P therefore its slope is greater. After P = 25 the slope of the square root scale decreases and drops faster than the slope of S = PP = 25 is the place where the slope changes from steeper to less steep and thus where the slopes are equal. This is the farthest point vertically above the percentage graph. This is also the point guaranteed by the MVT on the interval [0, 100].


[1] Assessing True Academic Success   by Dan Kennedy, The Mathematics Teacher, September 1999, page 462 – 466).
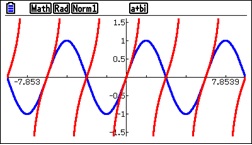


Graphing – an Application of the Derivative.

Graphing and the analysis of graphs given (1) the equation, (2) a graph, or (3) a table of values of a function and its derivative(s) makes up the largest group of questions on the AP exams. Most of the other applications of the derivative depend on understanding the relationship between a function and its derivatives.

Here is a list of posts on these topics. Since this list is rather long and the topic takes more than a week to (un)cover,

Tangents and Slopes

Concepts Related to Graphs

The Shapes of a Graph 

Open or Closed?  Concerning intervals on which a function increases or decreases.

Extreme Values

Concavity

Joining the Pieces of a Graph

Using the Derivative to Graph the Function

Real “Real life” Graph Reading

Comparing the Graph of a Function and its Derivative  Activities on comparing the graphs using Desmos.

Writing on the AP Calculus Exams   Justifying features of the graph of a function is a major point-earner on the AP Exams.

Reading the Derivative’s Graph Summary and my most read post!


Revised from a post of October 10, 2017


On Grading

I got to thinking about grading the other day after seeing a question on Facebook. We’ll get to that question in a minute, but first I want to try to outline a grading scheme I used towards the end of my teaching career. It is based on how free-response questions on AP Calculus exams are graded, but the ideas are usable in any course. Here are some suggestions and examples of how to do that. There are also some suggestions for grading multiple-choice and True-False questions.

Free-response questions

The AP Calculus scoring standards are considered as a guide for awarding partial credit. Partial credit is earned for taking correct steps on the way to the solution. Points are earned, not deducted. Examples that follow will expand on these principles:

  • Each step is worth 1 or 2 points. For 2-point steps, it must be possible to earn only one point.
  • Students earn the point(s) for showing they are doing a good thing.
  • Once earned, the point cannot be lost by some later mistake. (It’s “in the bank,” as readers say.)
  • Since a mistake will affect the final answer, the student may earn later points, including the answer point, for continuing correctly. However, some mistakes are so bad that earning the rest of the points is not possible. Mistakes must not simplify the remaining work.
  • The standard must allow for different methods of solution.

Example 1: Consider a typical volume problem worth four points. Students are required to write a definite integral. By the washer method the work should look like

\pi {{\int_{a}^{b}{{\left( {f(x)} \right)}}}^{2}}-{{\left( {g\left( x \right)} \right)}^{2}}dx= a numerical answer.

  • 1-point is earned for the constant and both limits of integration.
  • 2-points are earned for the integrand. If the integrand is of the form something squared minus something else squared, they earn 1-point; if both correct quantities are squared they earn the second point. If the integrand is something squared plus something else squared this is considered a calculus (major) mistake they earn 0 points and are not eligible for the answer point. (No deduction for a missing dx)
  • 1-point for the answer from their calculator. Saying that the correct answer is equal to an incorrect integral such as \pi {{\int_{a}^{b}{{\left( {g(x)} \right)}}}^{2}}-{{\left( {f\left( x \right)} \right)}^{2}}dx= 
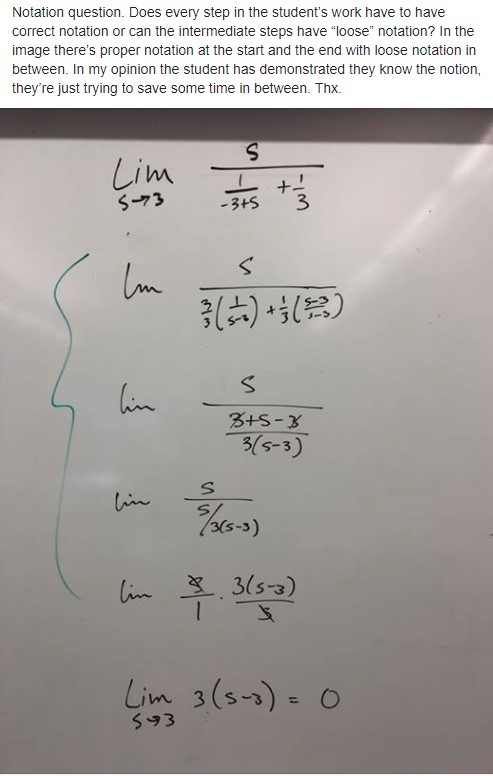
the correct answer is a mistake (negative = positive) and does not earn the answer point. However, the reversed integrand and the correct answer not connected by an equal sign recoups the integrand point and earns the answer point (i.e. full credit). (Subtracting in the wrong order and taking the opposite of your (negative) answer is a correct algorithm, even if inefficient and “ugly.”)

You can see how much consideration goes into setting the grading standards.

There is no reason you must use the exact AP exam standard. In your class you may want to be more specific in hopes of helping your students be more precise. You may make this question worth more points. So, you could use this standard:

  • 1-point for the \pi .
  • 2-points for the limits of integration (one each)
  • 1-point for the form of the integrand (square minus square)
  • 1-point for the first squared quantity
  • 1-point for the second squared quantity
  • 1-point for dx
  • 1-point for the answer from their calculator

Example 2: An example from Algebra 1. Find the solution of 4x-\left( {x-3} \right)=x+7. The expected solution is

4x-x+3=x+7

3x+3=x+7

2x=4

x=2

You could count this as 3-points:

  • 1-point for removing parentheses
  • 1-point for collecting like terms
  • 1-point for the answer

Or you could count it as

  • 1-point for knowing to remove parentheses
  • 1-point for removing parentheses correctly
  • 1-point for collecting the x-terms
  • 1-point for collecting the constant terms
  • 1-point for the answer – any arithmetic mistakes in collecting terms fails to earn the answer point

Example 3: from Algebra 1: Solve {{x}^{2}}-8x=9

Expected solution:

{{x}^{2}}-8x-9=0

\left( {x-9} \right)\left( {x+1} \right)=0

x=9\text{ or }x=-1

As a 3-point standard

  • 1-point for setting equal to zero
  • 1-point for factoring
  • 1-point for answers

Or a 5-point standard

  • 1-point for setting equal to zero
  • 2-points, one for each correct factor
  • 2-points, one for each answer.

However, whatever method you use should allow for a solution by quadratic formula, or completing the square, or even by graphing. (Unless the direction specifically read “Solve by factoring.”)

Example 4: This is the question that got me started on this post. It is from a September 20, 2018 post on the AP Calc TEACHERS – AB/BC Facebook page. The teacher’s question is at the top.

The teacher is right about being concerned with proper notation and right about requiring students to use it.

On an AP exam this limit would be a multiple-choice question (see below) and so notation does not enter in. Even on a free-response question – judging from past exams – only the answer would be required. Just because it’s an AP class, does not mean that you must do things only as they are done on the exams.

To provide for notation, this could be scored as a 3- or 4-point question:

  • 1 point for knowing what algebra to use to find the limit
  • 1-point for doing the algebra correctly (For a 3-point value, this could be included in the answer point, but there is a fair amount to do and it’s not straightforward, so an additional point here is reasonable.)
  • 1-point for the answer (If the student does not earn both of the first two points, then the answer should agree with their work.)
  • 1-point for correct use of limit notation throughout the problem.

The student in the example does not earn the last point. The solution shown earns 3 of 4 points (or 2 of 3).

But there is more here. Suppose the student did not write “lim” in the second through fifth lines of the solution; there is no reason the must since they are just doing some algebra. Also, the lines are not connected with equal signs. Then, he or she has not misused the notation and should earn full credit.

Some comments on the Facebook post were also concerned about dividing out the x’s and not mentioning that x\ne 0. If that is a concern for you, then another point could be included for that.

So, the idea is to be very precise about what earns a point and what does not. Seeing a “+3” instead of a “-1” next to their work encourages students. Noticing that a number of your students are not earning the same point will help you see where the class is confused. One of the reasons you give tests is to help you see where your class as a whole is missing some idea. Consider that when giving multiple-choice and True-False questions.


 Multiple-choice questions – forget scan sheets.

As a teacher, you need to see the students work, so you can find their mistakes and help them do better (a/k/a formative assessment). When giving a multiple-choice question, require students to show their work and award partial credit for incorrect answers. Two- or three-points seem to work well – one-point for knowing what to do, one-point for doing it, and one-point for the answer.

Examples:

  • Find where a function is increasing: one-point for knowing to examine the derivative, one-point for finding the derivative, one point for the answer.
  • Find the acceleration: one-point for finding the derivative of velocity, one-point for the answer.
  • Questions with statements I, II, and III: one-point for each statement identified correctly as true or false. (Think of the answer “I only” as T,F,F etc.)
  • Set up the integral: one-point for limits of integration, two-points for integrand (Algebra/notation mistake loses one point, calculus mistake loses both points).

True or False questions

For many years I used a textbook (I think it was Larson and Hostetler 2nd edition – I’m showing my age) that had True-False questions for each set of exercises. I really liked them. Newer textbooks rarely have them. One exception is the new Calculus for AP by Steward and Kokoska that starts almost every exercise set with a few True-False questions.

For two-points, have students say if the statement is true or false, AND require them to explain why the statement is true or false: what theorem or idea is illustrated; what hypothesis is not met, give counterexamples, etc.

Another approach to True-False questions is to change them to Always, Sometimes, or Never True questions.

For example: Is the statement “If f ”(a) =0, the (af(a)) is a point of inflection,” sometimes, always, or never true?

Answer: Sometimes. If f(x) = x3, then (0,0) is a point of inflection, but if f(x) = x4, then (0,0) is not a point of inflection.

Another answer: Sometimes: If f ”(x) changes sign at (af(a)), then (af(a))  is a point of inflection, if f ”(x) does not change sign at (af(a)) , then it is not a point of inflection.

You can then have the class discuss and criticize each other’s answers. These become good writing questions and good preparation for the “Justify your answer” and “Explain your reasoning” questions on the AP exams. For you, they help you see what the student is thinking and, if wrong, help them correct it (a/k/a formative assessment again).


Next Friday some thoughts On Scaling – and all tests are scaled.


Inverses

This series of posts reviews and expands what students know from pre-calculus about inverses. This leads to finding the derivative of exponential functions, ax, and the definition of e, from which comes the definition of the natural logarithm.

Inverses Graphically and Numerically

The Range of the Inverse

The Calculus of Inverses

The Derivatives of Exponential Functions and the Definition of e and This pair of posts shows how to find the derivative of an exponential function, how and why e is chosen to help this differentiation.

Logarithms Inverses are used to define the natural logarithm function as the inverse of ex. This follow naturally from the work on inverses. However, integration is involved and this is best saved until later. I will mention it then.

Two new post coming soon: