
Looking at the graphs of polar curves can be quite fascinating. Doing “calculus” kinds of things is different, yet the same as in Cartesian coordinates. A discussion on the AP Calculus Community here got me thinking about extreme values of polar functions.
The terms maximum and minimum here refers to the value of r(θ) which may be positive (when on the ray making an angle of θ with the polar axis), zero (at the pole), or negative (on the ray opposite to the one making an angle of θ with the polar axis). The distance from the pole to the point is |r(θ)|. As Mark Howell pointed out in the thread linked above, extreme values of r(θ) lie on a circle or circles centered at the pole with radius of |r(θ)|, and finding the slope of tangent lines at the extremes is relatively easy, requiring no calculus: the slope of the ray is y/x, so the slope of the tangent at the extreme is –x/y. As with Cartesian coordinates, at extreme values 
A quick look at the graph of simple polar functions seems to show obvious maximum values for r(θ), but a closer look reveals some complications.
The graph of 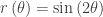
Thus, points may be both maximums and minimums.

Polar Curves can be really fun. While working on the idea above, I explored some other curves. Try some yourself using Desmos, GeoGabra, or another graphing app with sliders. Shown below are members of the family of polar curves 

- How very slight changes in the parameters give very different looking graphs
- Other values give far less “organized” curves
- In the third graph, the maximums and minimums on the irregular part of the curve closest to the pole
.

Pingback: Polar Equation Questions (Type 9) | Teaching Calculus
Thanks for the information. You make it look like really easy.
LikeLike
Lin, et al.-
I did a presentation on polar coordinates in calc and precalc at the 2017 NCTM Annual Meeting San Antonio. One of the more widely appreciated features was using TI-84 dynamic graphing to show wether or not places where two polar graphs cross are really intersections, and under what conditions the crossing points are not intersections. Email me (foerster@idworld.net) and I’ll fill you in on the details.
Paul
LikeLiked by 1 person