
Today’s Blog is an exploration that will lead up to the Mean Value Theorem (MVT) and, I hope, help your students better understand the MVT and why it is true.
While you may do this by hand, using a graphing calculator will make things way easier. This is good calculator practice and can be done on a graphing, non-CAS, calculator without writing anything down. Try it that way.
Here are the steps to follow. My solution with screen pictures is below.
- Choose your favorite differentiable function. Call it f(x) and enter it in your calculator as Y1.
- Choose two values, a and b, in the domain of your function. Save (store) these on your calculator as a and b.
- Find the slope of the line (a, f(a)) and (b, f(b)). It would be best, but not necessary, that the line intersects the function only at (a, f(a)) and (b, f(b)) not between them, and not be horizontal. Store this in your calculator as m.
- Write the equation of the line through (a, f(a)) and (b, f(b)) and enter it as Y2.
- Write a function, h(x), that gives the vertical distance between f(x) and the line found in step 3. (Hint: upper curve minus the lower.) Enter this as Y3
- Find the x-coordinate local extreme value of h(x). Store this number to c.
- Find the slope of the tangent line to f(x) at the value found in step 6.
- What do you notice? Compare your result and conclusion with the other in your class. Discuss.
My solution.
Step 1: I choose 
Step 2: I choose a = 1 and b = 3 and stored them in my calculator.
Step 3: I calculated the slope in my calculator – see first figure.

Step 4: The equation of the line is 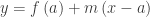
Step 5

Step 6:

Solve 
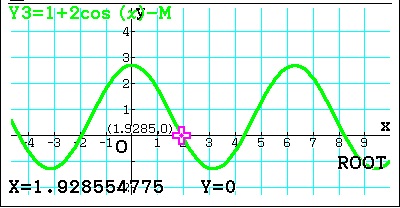
Step 6 and 7: I stored this value to C in my calculator and computed 
 Step 8: It is no coincidence that
The Mean Value Theorem states that for a function that is continuous on the interval [a, b] and differentiable on the open interval (a, b) there exists a number c in (a, b) such that

Additional Exploration:
- Can you show why
in step 5; set it equal to zero. Why must the solution be the value that makes
?
- What does this mean graphically?

- Pick a different value for a and/or b so that the line between (a, f(a)) and (b, f(b)) intersects f(x) two (or more) times. The derivative will now have two (or more) zeros. Find them and calculate the slope at each one. What do you notice?
Students often confuse the Mean Value Theorem, the Average Rate of Change of a function on an interval, and the Average Value of a function on an interval. This is understandable because of the similarity in their names and the similarity of their results. Be sure to point this out as you teach them and help them learn the meanings of each.
Other posts related to the Mean Value Theorem
Foreshadowing the MVT Other examples using this technique
Fermat’s Penultimate Theorem A lemma for Rolle’s Theorem: Any function extreme value(s) on an open interval must occur where the derivative is zero or undefined.
Rolle’s Theorem A lemma for the MVT: On an interval if a function is continuous on a closed interval [a, b] and differentiable on the open interval (a, b) and f(a) = f(b), there must exist a number c in the open interval (a, b) where f ‘(c) = 0.
Mean Value Theorem I Proof
Mean Value Theorem II Graphical Considerations
Darboux’s Theorem the Intermediate Value Theorem for derivatives.
The Definite Integral and the FTC
