
A common question in (older?) textbooks is to give students a function or relation and have them graph it without technology (because in the old days technology was not available). Students had to find all the appropriate information without hints or further direction: they were supposed to know what to do and do it.
AP exam questions, for legitimate and understandable reasons, do not ask for as complete an analysis. Rather, they ask students to find specific information about the function or its graph (extreme values, points of inflection, etc.). For the same legitimate and understandable reason many of the features are not considered; the other concepts are tested on different questions.
I think that the full-analysis-from-scratch approach, while not appropriate for an AP exam question, has its merits. The big difference is that students need to be creative in their investigation; not just focus on a few items pointed to by the question.
With that in mind, let’s consider the following question asked three ways.
A very general form
Consider the relation
. Discuss the graph of the relation giving reasons for your conclusions. Include a brief mention of any unproductive paths you followed and what you learned from them.
A more directed investigation
Consider the relation
Closer to an AP style form. The function here is the top half of the function above.
Consider the function
.
(a) Find the local maximum and minimum values of the function. Justify your answer.
(b) Where does the function had a vertical asymptote? Justify your answer.
(c) Find
and
. What does this say about the graph?
The real question is can you ask it the first way?
Here is my solution to the first form; this will also give the answers to the other forms. After the solution, I’ll discuss some ideas on how to score such a solution.
Solution
The graph of the relation
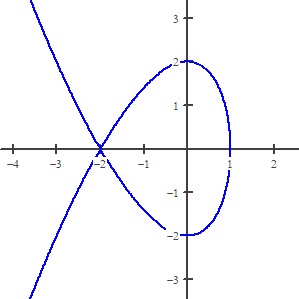
Figure 1
The domain of the function is 
The function is symmetric to the x-axis since substituting (–y) for y will give the same expression. The equation of the top half is
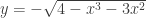
The derivative for the top half is 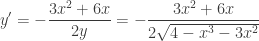


At (–2, 0) the derivative is an indeterminate form of the type 0/0.
False step: At first, I thought this meant that the two sides were tangent to the line x = –2 making the point (–2, 0) on the top half a cusp. I tried to see if this was true by graphing in a very narrow window. This did not show anything: the graph looked on zooming in, like an absolute value graph. It turned out that an absolute value was involved.
I then made a table of values for the derivative near the point and found that the values appeared to be approaching a number near –1.7 from the left and near +1.7 from the right. I started thinking maybe 
Then I changed the constants to parameters and played with the sliders on Desmos (here). With a slight change in the constants the graph appeared to have a nice rounded local minimum near x= –2. Other values showed two separate pieces with vertical tangents near x= –2. This confused me even more.
Next, I did what I should have done earlier: I graphed the top half and its derivative (figure 2):
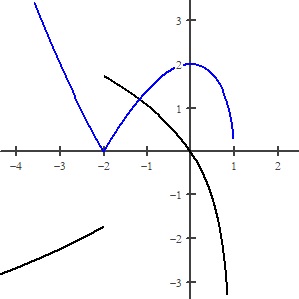
Figure 2. The top half in blue and its derivative in black.
The derivative has a finite jump discontinuity at x = –2. I remembered seeing this kind of thing before and thought it involved an absolute value of some kind. Still confused, I decided to investigate the derivative further (which I also should have done sooner).
The derivative at x = –2 is an indeterminate form of the 0/0 type. This means that by substituting you get an expression that really doesn’t help; you may still evaluate the limit (remember derivatives are limits) by other methods. Factoring the derivative (using synthetic division on the radicand) gives

And now we see that
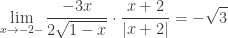
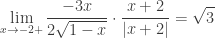
This agrees with the derivative’s graph. The top graph (and bottom’s by symmetry) comes to an arrow-like point (sometimes called a node) at (–2, 0). The slope on the left approaches 

______________________
I admit I’ve had a few more years of experience with this sort of thing that a first-year calculus student. I expect this would be difficult for most students who have never seen a question like this, so working up to it with simpler questions is how to start.
In grading this sort of question, you need to consider:
- If the student found and justified all the pertinent features of the graph. If they missed something, what they included may still be pretty good. For example, I would not expect a student to the use the word “node,” so omitting it should not be held against them and using it may call for praise.
- The things they (and I) may have overlooked or things they considered that were unnecessary or even wrong.
- Their overall approach. This last may be the most important part. Including their missteps and unproductive paths is important and should, I think, receive credit. After all, they did not know the path would be unproductive until they followed it a way. Hopefully, they made some missteps and learned something from them. That’s what investigating something in math entails.
I would be happy to hear if you tried this or something similar and so would the other readers of this blog. Please use the “Comment” button below to share your thoughts.
