Being a believer in the Rule of Four, I have been trying for years to find a good visual (graphical) illustration of why or how the Chain Rule for derivatives works. This very simple example is the best I could come up with.
Consider the function  . (See figure 1. A tangent segment at
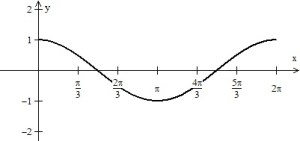
  is drawn.) As you know, this function’s values go smoothly from 0 to 1 to 0 to –1 and back to 0. The slopes of its tangent line, its derivative, appears to go from 1 to 0 to –1 to 0 to 1 as you would expect knowing its derivative is
  . (See figure 2)
-

-
Figure 1: y = sin(x)
-
-
Figure 2: dy/dx = cos(x)
Consider the function  (See figure 3. A tangent line at
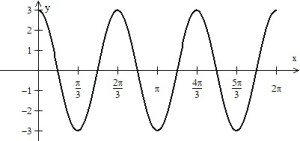
  is drawn) This takes on all the values of the sine function three times between 0 and
  . It goes through the same values three times as fast and therefore, its rate of change (yeah, the derivative) should be three times as much. Compare the tangent lines in Figures 1 and 3. This agrees with the derivative found by the Chain Rule:
  . See figure 4)
-

-
Figure 3 : y = sin(3x)
-
-
Figure 4: y = 3cos(3x)
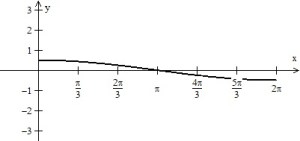
Next, consider the function  (See figure 5. A tangent line at
  is drawn.). This time the function is stretch and only goes through half its period. So, It goes through the same values half as fast as the original and the slope is only half as steep as the original. Compare the tangent lines in Figures 1 and 5.Therefore, the rate of change the derivative, should be only half the original’s. So,
  (See figure 6)
-

-
Figure 5: y = sin(x/2)
-
-
dy/dx = (1/2)cos(x/2)
I hope this helps your students see what’s happening with the Chain Rule, at least a little bit. I’d be happy to hear and share any ideas you have to illustrate the Chain Rule graphically.
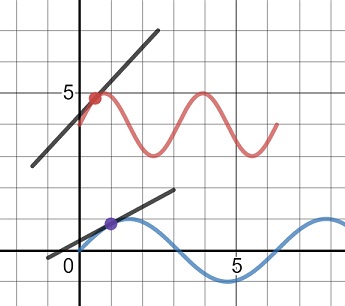
There is a movable Desmos graph here to help illustrate all of this.
Here are links to other posts on the Chain Rule
Foreshadowing the Chain Rule
The Power Rule Implies Chain Rule
The Chain Rule
Derivative Practice – Numbers
Derivative Practice – Graphs
Experimenting with CAS – Chain Rule


Pingback: Seeing the Chain Rule | MATHMANMCQ