
Continuing with our discussion of ways to produce interesting designs with the Roulette Generator (RG) for Winplot, here are some hints on making more detailed designs using more than one function.
Hint #5: Adding more graphs to the first: You may add other graphs by selecting the roulette and/or velocity equations from the Inventory (CTRL+I) and clicking “dupl” to duplicate the equation. Then click the duplicate and then “edit” and change the sign in front of the S in both equations. This will let you graph S and –S at the same time. This will give you two congruent graphs with the first rotated 

You may also change the color of all the graphs.
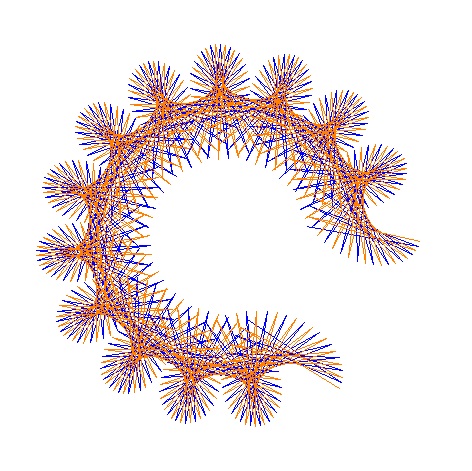
Here is a graph with that idea. The values are in the caption.

R = -0.322, S = -0.3 (blue) and S = +0.3 (green) and their derivatives (orange and gray),
15 Revolutions
Hint #6: Plotting Density (PD) (Winplot RG only) also affects the final drawing. Graphers work by calculating a number of points and joining them with straight segments. The default plotting density is 1. Usually this results in a nice graph with smooth looking curves because the segments are very short. If your graph looks like a bunch of segments, select the equation in the Inventory, click “edit”, and increase the plotting density (to 10 or 100 or more) and the curves will no longer look like segments. Of course, you may want them to look like segments. The graph below shows how PD works. The graph on the left has a plotting density of 10. The center graph is a detail of the first with the same PD. The plot on the right is the same as the center graph but with a plotting density of 100.
-

- PD = 10
-

- Detail: PD = 10
-

- Detail PD = 100
Hint #7: In addition to PD, Winplot is very sensitive to image size and zooming in and out. Once you have a graph you like, experiment with zooming in and our (page-up and page-down keys) or dragging the corners of the frame. You will see a lot of different graphs.
Your turn: Try making this graph below with 
Every slight change makes a whole new design. Start with your own values. I would like to see what you and your students come up with. When you get the perfect one, e-mail it to me as a .jpg file and I will post it. (Please include the S, R, and other data.
