
In “Local Linearity II”, my post for August 31, 2012, we developed a way of approximating the slope of a function at any point. The slope at x = a is approximated by
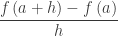
For small values of h.
The smaller the better, which suggests limits.
The limit of this expression as h approaches zero is called the derivative of f at x = a denoted by 

Now give your students a simple function like y = x2 and give each student a different point in the interval [–4, 4] (include some fractions). Have them calculate the approximate slope and/or the derivative for their point. For each student’s value, plot on a graph the point (their a, slope at their a). Discuss the results. Guess the equation of the graph.
Of course, the result should look like the line y = 2x. That is, the derivatives at various points, taken together, appear to be a function in their own right.
Repeat this exercise with the function y = sin(x). Guess the equation of the derivative.
We will look at this some more in the next post.
