
While calculus teachers are concerned with the new format of this year’s AP Calculus exams, there is other testing that is important now: tests for disease. Today’s post is not about calculus; mathematically, it is about conditional probability. In the big picture, it is about tests for disease and their accuracy. .
No test for any disease is totally accurate. Here are some notes on the concerns with testing.
The results of a health-related test fall into four categories. Before listing them I will define some variables:
- Let n be the number of people tested
- Let r be the proportion of the population tested who have the disease. 0 < r < 1. This number must be an estimate.
- Let a be the accuracy of the test. That is, the proportion of the test results that are correct (true). No test is 100% accurate, so 0 < a < 1. The tests are developed with known samples, so a is based on that result. See [3] for values of actual tests.
The four categories of results are:
- True positive results (T+). The person tested has the disease and the test correctly identifies indicates this
- True negative results (T-). The person tested does not have the disease and the test correctly indicates this
- False positive result (F+). The person tested does not have the disease, but the test incorrectly indicates they do.
- False negative result (F-). The person tested has the disease and the test incorrectly indicates they do not.


The concern is with the latter two categories.
- The proportion of positive results that are false is the false positive rate (also called the sensitivity) – the number of false positive results divided by the total number of positive results =
. The n has simplified out of the expression. Even for accurate tests, this number may be quite large.
- The proportion of negative results that are false is the false negative rate (also called the specificity) – the number of false negative results divided by the total number of false results =
. The n has simplified out of the expression.
…[A]accuracy needs to be high. The prevalence of Covid-19 is estimated at around 5% in the US, and at this low level the risk of false positives becomes a major problem. If a serological test [a blood test for the virus’s antibodies] has 90% specificity, its positive predictive value will be 32.1% – meaning nearly 70% of positive results will be false. At this same disease prevalence, a test with 95% specificity will lead to a 50% false positive rate. Only at 99% specificity does the false positive rate become anywhere near acceptable, and even here 16% of positive results would still be wrong.
Elizabeth Cairns at Evaluate
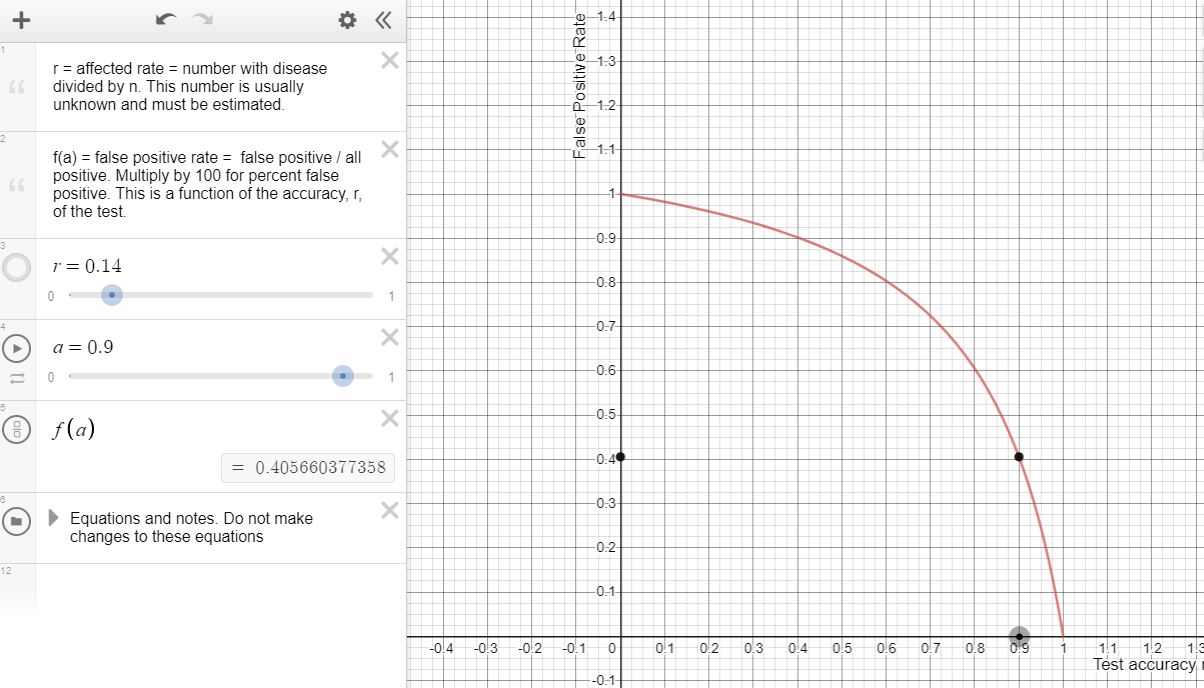
To examine the false positive rate, you may use this Desmos graph. Use the r-slider to adjust the proportion of the population that is believed to be affected. Use the a-slider to change the accuracy of the test. The number given by f(a) is the false positive rate.
Last week the results of a preliminary random sample of New York state residents for Covid-19 indicated a state-wide infection rate of 14% (r = 0.14). (This, I hope, is high, but it is what we have at the moment.) The accuracy of the test was not given. Assuming a 90% accuracy rate (a = 0.90), gives a false positive rate of just over 40% (f(0.90) = 0.406). Even at 95% accuracy (a = 0.95), the false positive rate is 50%. The graph below is set for these values. You may investigate other settings using the link above.
This is the concern. About 40% of the positive results are false; the people are told they have the disease, but they do not. Only about 60% of the positive results are correct. We don’t know which among the positive results really have the disease. We cannot tell for any individual, yet they all must be treated as though they have the disease using up valuable resources.
This happens because a very large number of people do not have the disease: the inaccuracy of the test produces a large number of false positive results. This concern is inherent in all such tests and must be accounted for. It is very important to have extremely accurate tests or to be able to account for the false positives.
A similar graph for the false negative results is here. Using the same values as above, the false negative rate is about 1.7%. These people have the disease but are told they don’t. This too is a concern, since they won’t get treated.
Please stay well and stay home.
REFERENCES
- False Positive Rates
- Sensitivity and Specificity
- Covid-19 Antibody Tests Face a Very Specific Problem This article contains a list of the accuracy figures (sensitivity (false positive rate) and specificity (false negative rate)) of the currently available tests for SARS-CoV-2, the virus that causes Covid-19.
- The Evaluate website has good daily updates on worldwide Covid-19 data.
..
