
I found a curious fact in a textbook today that relates to the Intermediate Value Theorem [1]. It claimed that if you draw a circle of any size on a map, there will be two diametrically opposite points on the circle at which the temperature will be the same!
This might make an interesting example when you are talking about the IVT.
The proof goes like this:
Assume the temperature varies continuously between every pair of points. Draw a circle of any radius on your map. Put a polar coordinate system on the map with the pole at the center of the circle and let 


Case I:If 

Case II: If 


Case III is like Case II with 
Without so many equations, this says that if you keep track of the temperature difference at the ends of the diameter on the way around the first half of the circle and find a net decrease in the temperature difference, then on your way around the second half of the circle (returning to the starting point) you must see a net increase. Somewhere between the decrease and the increase you must have a point where the difference is zero – the temperatures at the ends will be the same.
Now, I wasn’t really convinced. Yes, I believe proofs, but still…. So, I looked at a weather map [2]
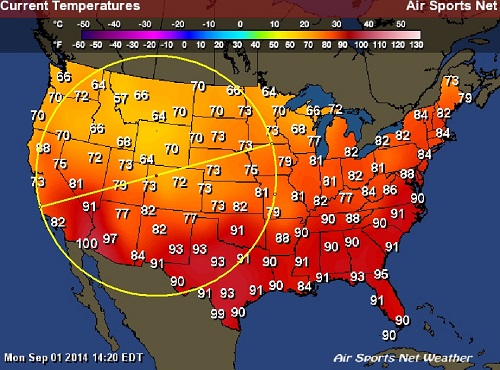
Consider the circle drawn on the map. From Iowa to Canada the temperature decreases from 79 to 66. Meanwhile over in California the temperature increases from 73 near San Francisco to 82 in Los Angeles. With a little visual interpolation, the temperatures at the ends of the diameter seem to be about equal. Try it with your own weather map.
Make your own circle and space the temperatures evenly on both sides. The diameter with the same temperatures will be ¼ of the way around. Try again with unevenly spaced temperatures; you will still find a place.
This is similar to the mountain climbing problem: If you climb a mountain during certain hours one day and climb back down during the same hours the next day, then there will be a place that you pass at the same time on both days.
_______________________________
References:
[1] Calculus by Rogowski and Cannon, Second edition, Section 2.8 exercise 26
[2] Air Sports New Weather for September 1, 2014, 14:20 EDT
Revised September 3, 2014 12:50 to fix some problems with the equations appearing properly.

This is the one dimensional case of the celebrated Borsuk-Ulam Theorem which states that for a continuous function from S^n to R^n there always exist a pair of antipodal points at which the function takes equal values. Thus at any time there are antipodal points on the Earth’s surface at which both the temperature and barometric pressure are equal. So at any time there are antipodal points on the surface of the Earth which are experiencing similar weather.
I believe that Ulam was the first to state this theorem but without an adequate proof which was first supplied by Karel Borsuk. The Borsuk-Ulam Theorem has many interesting applications.
A proof of the Borsuk-Ulam Theorem is a high point of most introductory texts on algebraic topology.
LikeLike
Jim – Thanks for the input. Those of you who are interested in this can find more information about the Borsuk-Ulam Theorem by doing a Google search.
LikeLike